| Name |
Characteristics |
| Panic of 1785 |
1785–1788 |
The panic of 1785, which lasted until 1788, ended the business boom that
followed the American Revolution. The causes of the crisis lay in the
overexpansion and debts incurred after the victory at Yorktown, a postwar
deflation, competition in the manufacturing sector from Britain, and lack of
adequate credit and a sound currency. The downturn was exacerbated by the
absence of any significant interstate trade. Other factors were the British
refusal to conclude a commercial treaty, and actual and pending defaults
among debtor groups. The panic among business and propertied groups led to
the demand for a stronger federal government. |
|
Copper Panic of 1789 |
17961789–1793 |
Loss of confidence in copper coins due to debasement and counterfeiting
led to commercial freeze up that halted the economy of several northern
States and was not alleviated until the introduction of new paper money to
restore confidence. |
|
Panic of 1797 |
17961796–1799 |
Just as a land speculation bubble was bursting, deflation from the
Bank of England (which was facing insolvency because of the cost of
Great Britain's involvement in the
French Revolutionary Wars) crossed to North America and disrupted
commercial and
real
estate markets in the United States and the
Caribbean,
and caused a
major financial panic.[10]
Prosperity continued in the south, but economic activity was stagnant in the
north for three years. The young United States engaged in the
Quasi-War
with France.[8] |
| 1802–1804 recession |
18021802–1804 |
A boom of war-time activity led to a decline after the
Peace of Amiens ended the
war between the United Kingdom and France. Commodity prices fell
dramatically. Trade was disrupted by pirates, leading to the
First Barbary War.[8] |
| Depression of 1807 |
18071807–1810 |
The
Embargo Act of 1807 was passed by the
United States Congress under President
Thomas Jefferson as tensions increased with the United Kingdom. Along
with trade restrictions imposed by the British, shipping-related industries
were hard hit. The
Federalists fought the embargo and allowed smuggling to take place in
New
England. Trade volumes, commodity prices and securities prices all began
to fall.
Macon's Bill Number 2 ended the embargoes in May 1810, and a recovery
started.[8] |
| 1812 recession |
18121812 |
The United States entered a brief recession at the beginning of 1812.
The decline was brief primarily because the United States soon increased
production to fight the
War
of 1812, which began June 18, 1812.[11] |
| 1815–21 depression |
18151815–1821 |
Shortly after the war ended on March 23, 1815, the United States entered
a period of financial panic as bank notes rapidly depreciated because of
inflation following the war. The 1815 panic was followed by several years of
mild depression, and then a major financial crisis – the
Panic of 1819, which featured widespread
foreclosures, bank failures,
unemployment, a collapse in real estate prices, and a slump in
agriculture and
manufacturing.[8] |
| 1822–1823 recession |
18221822–1823 |
After only a mild recovery following the lengthy 1815–21 depression,
commodity prices hit a peak in March 1822 and began to fall. Many businesses
failed, unemployment rose and an increase in imports worsened the trade
balance.[8] |
| 1825–1826 recession |
18251825–1826 |
The
Panic of 1825, a stock crash following a bubble of speculative
investments in Latin America led to a decline in business activity in the
United States and England. The recession coincided with a major panic, the
date of which may be more easily determined than general cycle changes
associated with other recessions.[7] |
| 1828–1829 recession |
18281828–1829 |
In 1826, England forbade the United States to trade with English
colonies, and in 1827, the United States adopted a counter-prohibition.
Trade declined, just as credit became tight for manufacturers in New
England.[8] |
| 1833–34 recession |
18331833–1834 |
The United States' economy declined moderately in 1833–34. News accounts
of the time confirm the slowdown. The subsequent expansion was driven by
land speculation.[12] |
US recessions, Free Banking Era to the Great Depression
| Name |
Characteristics |
| 1836–1838 recession |
-32.8% |
— |
A sharp downturn in the
American economy was caused by bank failures and lack of confidence in
the paper
currency. Speculation markets were greatly affected when
American banks stopped payment in
specie
(gold and silver coinage).[3][13]
Over 600 banks failed in this period. In the South, the cotton market
completely collapsed.[8]
See:
Panic of 1837 |
| late 1839–late 1843 recession |
-34.3% |
— |
This was one of the longest and deepest depressions. It was a period of
pronounced
deflation
and massive default on debt. The Cleveland Trust Company Index showed the
economy spent 68 months below its trend and only 9 months above it. The
Index declined 34.3% during this depression.[14] |
| 1845–late 1846 recession |
−5.9% |
— |
This recession was mild enough that it may have only been a slowdown in
the growth cycle. One theory holds that this would have been a recession,
except the United States began to gear up for the
Mexican–American War, which began April 25, 1846.[15] |
| 1847–48 recession |
−19.7% |
— |
The Cleveland Trust Company Index declined 19.7% during 1847 and 1848.
It is associated with a
financial crisis in Great Britain.[14][16] |
|
1853–54 recession |
−18.4% |
— |
Interest rates rose in this period, contributing to a decrease in
railroad investment. Security prices fell during this period. With the
exception of falling business investment there is little evidence of
contraction in this period.[3] |
|
Panic of 1857 |
−23.1% |
— |
Failure of the
Ohio Life Insurance and Trust Company burst a European speculative
bubble in
United States' railroads and caused a loss of confidence in
American banks. Over 5,000 businesses failed within the first year of
the Panic, and unemployment was accompanied by protest meetings in urban
areas. This is the earliest recession to which the NBER assigns specific
months (rather than years) for the peak and trough.[5][7][17] |
| 1860–61 recession |
−14.5% |
— |
There was a recession before the
American Civil War, which began April 12, 1861. Zarnowitz says the data
generally show a contraction occurred in this period, but it was quite mild.[14]
A financial panic was narrowly averted in 1860 by the first use of
clearing house certificates between banks.[8] |
| 1865–67 recession |
−23.8% |
— |
The
American Civil War ended in April 1865, and the country entered a
lengthy period of general deflation that lasted until 1896. The United
States occasionally experienced periods of recession during the
Reconstruction era. Production increased in the years following the
Civil War, but the country still had financial difficulties.[14]
The post-war period coincided with a period of some
international financial instability. |
| 1869–70 recession |
−9.7% |
— |
A few years after the Civil War, a short recession occurred. It was
unusual since it came amid a period when railroad investment was greatly
accelerating, even producing the
First Transcontinental Railroad. The railroads built in this period
opened up the interior of the country, giving birth to the
Farmers' movement. The recession may be explained partly by ongoing
financial difficulties following the war, which discouraged businesses from
building up inventories.[14]
Several months into the recession, there was a
major financial panic. |
|
Panic of 1873 and the
Long Depression |
−33.6% (−27.3%)
[nb 3] |
— |
Economic problems in Europe prompted the failure of
Jay Cooke
& Company, the largest bank in the United States, which burst the post-Civil
War
speculative bubble. The
Coinage Act of 1873 also contributed by immediately depressing the price
of silver, which hurt North American mining interests.[18]
The deflation and wage cuts of the era led to labor turmoil, such as the
Great Railroad Strike of 1877. In 1879, the United States returned to
the gold standard with the
Specie Payment Resumption Act. This is the longest period of economic
contraction recognized by the NBER. The
Long Depression is sometimes held to be the entire period from 1873–96.[19][20] |
|
1882–85 recession |
−32.8% |
−24.6% |
Like the Long Depression that preceded it, the recession of 1882–85 was
more of a
price depression than a production depression. From 1879 to 1882, there
had been a boom in railroad construction which came to an end, resulting in
a decline in both railroad construction and in related industries,
particularly iron and steel.[21]
A major economic event during the recession was the
Panic of 1884. |
| 1887–88 recession |
−14.6% |
−8.2% |
Investments in railroads and buildings weakened during this period. This
slowdown was so mild that it is not always considered a recession.
Contemporary accounts apparently indicate it was considered a slight
recession.[22] |
| 1890–91 recession |
−22.1% |
−11.7% |
Although shorter than the recession in 1887–88 and still modest, a
slowdown in 1890–91 was somewhat more pronounced than the preceding
recession. International monetary disturbances are blamed for this
recession, such as the
Panic of 1890 in the United Kingdom.[22] |
|
Panic of 1893 |
−37.3% |
−29.7% |
Failure of the United States
Reading Railroad and withdrawal of European investment led to a
stock market and banking collapse. This Panic was also precipitated in
part by a
run on the gold supply. The Treasury had to issue bonds to purchase
enough gold. Profits, investment and income all fell, leading to political
instability, the height of
the U.S. populist movement and the
Free Silver movement.[23] |
|
Panic of 1896 |
−25.2% |
−20.8% |
The period of 1893–97 is seen as a generally depressed cycle that had a
short spurt of growth in the middle, following the Panic of 1893. Production
shrank and deflation reigned.[22] |
| 1899–1900 recession |
−15.5% |
−8.8% |
This was a mild recession in the period of general growth beginning
after 1897. Evidence for a recession in this period does not show up in some
annual data series.[22] |
| 1902–04 recession |
−16.2% |
−17.1% |
Though not severe, this downturn lasted for nearly two years and saw a
distinct decline in the national product. Industrial and commercial
production both declined, albeit fairly modestly.[22]
The recession came about a year after a
1901 stock crash. |
|
Panic of 1907 |
−29.2% |
−31.0% |
A run on
Knickerbocker Trust Company deposits on October 22, 1907, set events in
motion that would lead to a severe monetary contraction. The fallout from
the panic led to Congress
creating the Federal Reserve System.[24] |
|
Panic of 1910–1911 |
−14.7% |
−10.6% |
This was a mild but lengthy recession. The national product grew by less
than 1%, and commercial activity and industrial activity declined. The
period was also marked by deflation.[22] |
| Recession of 1913–1914 |
−25.9% |
−19.8% |
Productions and real income declined during this period and were not
offset until the start of
World
War I increased demand.[22]
Incidentally, the
Federal Reserve Act was signed during this recession, creating the
Federal Reserve System, the culmination of a sequence of events
following the
Panic of 1907.[24] |
|
Post-World War I recession |
−24.5% |
−14.1% |
Severe
hyperinflation in Europe took place over production in North America.
This was a brief but very sharp recession and was caused by the end of
wartime production, along with an influx of labor from returning troops.
This, in turn, caused high unemployment.[25] |
|
Depression of 1920–21 |
−38.1% |
−32.7% |
The 1921 recession began a mere 10 months after the post-World War I
recession, as the economy continued working through the shift to a peacetime
economy. The recession was short, but extremely painful. The year 1920 was
the single most deflationary year in American history; production, however,
did not fall as much as might be expected from the deflation. GNP may have
declined between 2.5 and 7 percent, even as wholesale prices declined by
36.8%.[26]
The economy had a strong recovery following the recession.[27] |
| 1923–24 recession |
−25.4% |
−22.7% |
From the depression of 1920–21 until the Great Depression, an era dubbed
the
Roaring Twenties, the economy was generally expanding. Industrial
production declined in 1923–24, but on the whole this was a mild recession.[22] |
| 1926–27 recession |
−12.2% |
−10.0% |
This was an unusual and mild recession, thought to be caused largely
because
Henry Ford closed production in his factories for six months to switch
from production of the
Model T to the
Model A.
Charles P. Kindleberger says the period from 1925 to the start of the
Great Depression is best thought of as a boom, and this minor recession just
proof that the boom "was not general, uninterrupted or extensive".[28] |
| |
Characteristics |
|
Great Depression |
1929Aug
1929 –
Mar 1933 |
24.924.9%[32]
(1933) |
26.7−26.7% |
Stock markets crashed worldwide. A banking collapse took place in the
United States.
Extensive new tariffs and
other factors contributed to an extremely deep depression. The United
States did remain in a depression until World War II. In 1936, unemployment
fell to 16.9%, but later returned to 19% in 1938 (near 1933 levels). |
|
Recession of 1937–1938 |
1937May
1937 –
June 1938 |
19.019.0%[33]
(1938) |
03.4−18.2% |
The
Recession of 1937 is only considered minor when compared to the Great
Depression, but is otherwise among the worst recessions of the 20th century.
Three explanations are offered for the recession: that tight fiscal policy
from an attempt to balance the budget after the expansion of the
New Deal
caused recession, that tight monetary policy from the Federal Reserve caused
the recession, or that declining profits for businesses led to a reduction
in investment.[34] |
| Recession of 1945 |
1945Feb–Oct
1945 |
05.25.2%[33]
(1946) |
12.7−12.7% |
The decline in government spending at the end of World War II led to an
enormous drop in gross domestic product, making this technically a
recession. This was the result of demobilization and the shift from a
wartime to peacetime economy. The post-war years were unusual in a number of
ways (unemployment was never high) and this era may be considered a "sui
generis end-of-the-war recession".[35] |
|
Recession of 1949 |
1948Nov
1948 –
Oct 1949 |
07.97.9%
(Oct 1949) |
01.7−1.7% |
The 1948 recession was a brief economic downturn; forecasters of the
time expected much worse, perhaps influenced by the poor economy in their
recent lifetimes.[36]
The recession also followed a period of monetary tightening.[30] |
|
Recession of 1953 |
1953July
1953 –
May 1954 |
06.16.1%
(Sep 1954) |
02.6−2.6% |
After a post-Korean
War inflationary period, more funds were transferred to
national security. In 1951, the Federal Reserve
reasserted its independence from the U.S. Treasury and in 1952, the
Federal Reserve changed monetary policy to be more restrictive because of
fears of further inflation or of a
bubble forming.[30][37][38] |
|
Recession of 1958 |
1957Aug
1957 –
April 1958 |
.57.5%
(July 1958) |
03.1−3.7% |
Monetary policy was tightened during the two years preceding 1957,
followed by an easing of policy at the end of 1957. The budget balance
resulted in a change in
budget surplus of 0.8% of GDP in 1957 to a
budget deficit of 0.6% of GDP in 1958, and then to 2.6% of GDP in 1959.[30] |
|
Recession of 1960–61 |
1960Apr
1960 –
Feb 1961 |
17.1%
(May 1961) |
01.6−1.6% |
Another primarily monetary recession occurred after the Federal Reserve
began raising interest rates in 1959. The government switched from deficit
(or 2.6% in 1959) to surplus (of 0.1% in 1960). When the economy emerged
from this short recession, it began the second-longest period of growth in
NBER history.[30]
The Dow Jones Industrial Average (Dow) finally reached its lowest point on
Feb. 20, 1961, about 4 weeks after President Kennedy was inaugurated. |
|
Recession of 1969–70 |
1969Dec
1969 –
Nov 1970 |
6.1%
(Dec 1970) |
00.6−0.6% |
The relatively mild 1969 recession followed a lengthy expansion. At the
end of the expansion, inflation was rising, possibly a result of increased
deficits. This relatively mild recession coincided with an attempt to start
closing the budget deficits of the
Vietnam War (fiscal tightening) and the Federal Reserve raising interest
rates (monetary tightening).[30] |
|
1973–75 recession |
1973Nov
1973 –
Mar 1975 |
9.0%
(May 1975) |
03.2−3.2% |
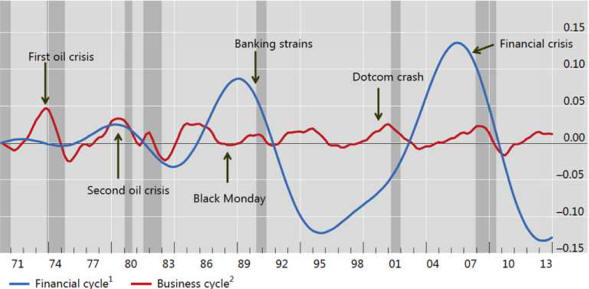
A quadrupling of oil prices by
OPEC coupled
with high government spending because of the Vietnam War led to
stagflation in the United States.[39]
The period was also marked by the
1973 oil crisis and the
1973–1974 stock market crash. The period is remarkable for rising
unemployment coinciding with rising inflation.[40] |
|
1980 recession |
1980Jan–July
1980 |
7.8%
(July 1980) |
02.2−2.2% |
The NBER considers a very short recession to have occurred in 1980,
followed by a short period of growth and then a deep recession. Unemployment
remained relatively elevated in between recessions. The recession began as
the Federal Reserve, under
Paul Volcker, raised interest rates dramatically to fight the
inflation of the 1970s. The early '80s are sometimes referred to as a "double-dip"
or "W-shaped"
recession.[30][41] |
|
Early 1980s recession |
1981July
1981 –
Nov 1982 |
10.8%
(Nov 1982) |
02.7−2.7% |
The
Iranian Revolution sharply increased the price of oil around the world
in 1979, causing the
1979 energy crisis. This was caused by the new regime in power in
Iran, which
exported oil at inconsistent intervals and at a lower volume, forcing prices
up. Tight
monetary policy in the United States to control inflation led to another
recession. The changes were made largely because of inflation carried over
from the previous decade because of the
1973 oil crisis and the 1979 energy crisis.[42][43] |
|
Early 1990s recession |
1990July
1990 –
Mar 1991 |
7.8%
(June 1992) |
01.4−1.4% |
After the lengthy peacetime expansion of the 1980s, inflation began to
increase and the Federal Reserve responded by raising interest rates from
1986 to 1989. This weakened but did not stop growth, but some combination of
the subsequent
1990 oil price shock, the debt accumulation of the 1980s, and growing
consumer pessimism combined with the weakened economy to produce a brief
recession.[44][45][46] |
|
Early 2000s recession |
2001March
2001–Nov 2001 |
6.3%
(June 2003) |
00.3−0.3% |
The 1990s were the longest period of growth in American history. The
collapse of the speculative
dot-com bubble, a fall in business outlays and investments, and the
September 11th attacks,[47]
brought the decade of growth to an end. Despite these major shocks, the
recession was brief and shallow.[48]
Without the September 11th attacks, the economy might have avoided recession
altogether.[47
] |
|
Great Recession |
2007Dec
2007 – June 2009[49][50] |
10.0%
(October 2009)[51] |
03.9−4.3% |
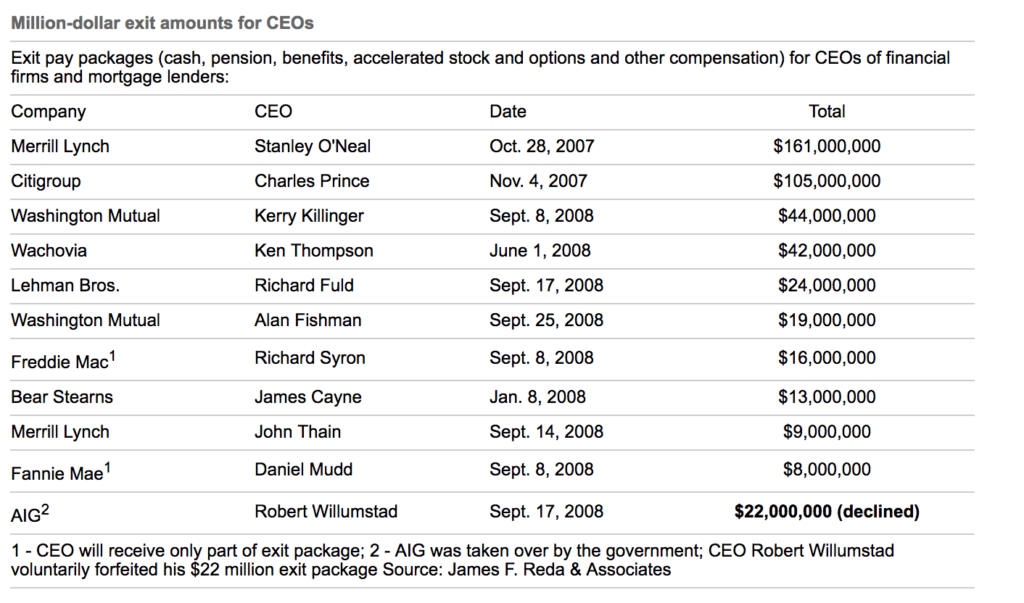
The
subprime mortgage crisis led to the collapse of the
United States housing bubble. Falling housing-related assets contributed
to a
global financial crisis, even as oil and food prices soared. The crisis
led to the failure or collapse of many of the United States' largest
financial institutions:
Bear Stearns,
Fannie
Mae,
Freddie Mac,
Lehman Brothers, City Bank and
AIG, as well as a crisis in the
automobile industry. The government responded with an unprecedented
$700 billion bank bailout and
$787 billion fiscal stimulus package. The National Bureau of Economic
Research declared the end of this recession over a year after the end date.[52]
The Dow Jones Industrial Average (Dow)
finally reached its lowest point on March 9, 2009.[ |


.svg)