Chapter 21
How Cost of Production Affects Supply
II. Understanding Labor Productivity
Time Value of Money videos
Chapter 22 Understanding Profit
|
Chapter 21
How Cost of Production Affects Supply |
||
|
II. Understanding Labor Productivity |
Time Value of Money videos Chapter 22 Understanding Profit |
|
|
Lecture Notes 1-page printable lecture notes
A.
Introduction
1. Explicit
costs require an out-of-pocket expenditure, e.g., wages, C. Short run versus long run costs
1. In the short
run costs are both fixed and variable. D. Diminishing returns:
1. Adding
a variable resource (labor) to a fixed resource (capital) will E. Accounting profits versus economic profits
1. Accounting
profit is revenue minus explicit costs.
US Capacity Utilization Back to 2016 Levels - The Sounding Line
|
Supplemental
Current Slow Down is Not Unprecedented
With Asian Competition,
Service Productivity Improved Because Fewer Workers Needed |
| II. Understanding Labor Productivity
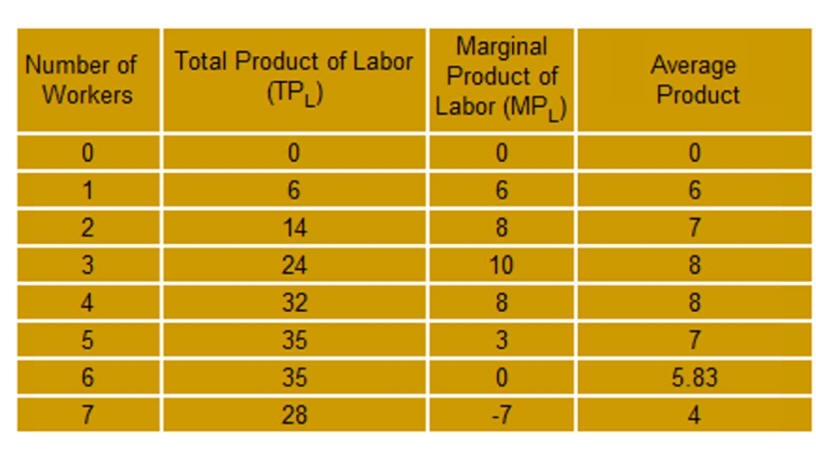
Total product of labor (TPL) measures total
production occurring as more workers are added to a production process
containing fixed resources. Educating the Class of 2034.htm applies productivity theory to education. Other Micro Chapters19) Elasticity of Demand Affects Total Revenue 20) Consumer Behavior and Demand Theory See Managerial Accounting Internet Library
|

Stage 1 Increasing marginal
returns to scale (getting bigger) Stage 2 Decrease marginal
returns to scale because of Stage 3 Negative marginal returns to scale because workers |
|
III. Determining Production Costs |
|
Units Produced (1) |
Total
Fixed Costs (2) |
Total Variable
Costs (3) |
Total Costs (2+3) |
Marginal
Costs is change in TC per unit |
Average Fixed
Costs (2/1) |
Average
Variable Costs (3/1) |
Average Total Costs (2+3)/1 |
| 0 | 500 | 0 | 500 | NA | |||
| 1 | 500 | 500 | 1000 | 500 | 500 | 500 | 1000 |
| 2 | 500 | 900 | 1400 | 400 | 250 | 450 | 700 |
| 3 | 500 | 1200 | 1700 | 300 | 167 | 400 | 567 |
| 4 | 500 | 1500 | 2000 | 300 | 125 | 375 | 500 |
| 5 | 500 | 1900 | 2400 | 400 | 100 | 380 | 480 |
| 6 | 500 | 2400 | 2900 | 500 | 83 | 400 | 483 |
| 7 | 500 | 3000 | 3500 | 600 | 71 | 429 | 500 |
See Linear Thinking in a Nonlinear World
|
Note that AV is the mirror image of AP and MC is the mirror image of MP. |
Analysis:
At low quantities MC is below AVC so AVC is falling. As MC starts to rise AVC flattens but continues to decrease because MC is still lower. When MC rises above AVC, AVC immediately begins to rise indicating the intersection must be AVC's lowest point. |
U.S. and Germany Lead the Way
|
|
VI. Total Variable Costs A. Not a straight line but an S-shaped curve. B. Economies and diseconomies of scale |
||
|
Start-up costs
cause the
curve to rise quickly at low levels of production. Examples
include Incorporating, legal and accounting, Licenses and permits,
Remodeling, Rent, Security Deposit or Real Estate Purchase, Signage and
marketing materials, Initial inventory Supplies, Furniture and Equipment.
Economies of scale make production very efficient causing the curve to flatten out over a considerable range of production. Examples include labor/management specialization, volume discounts, and use of by-product. Those wanting additional reading see Economies of scale - wiki Diseconomies of scale cause production to be inefficient and result in the curve rising sharply as maximum capacity is approached. Examples include Bureaucracy and diminishing returns. Japanese flexible production techniques enhance economies of scale and stretched out the low point on the AVC line. These techniques have been adopted by manufacturers around the world. see Diseconomy of scale Wikipedia, the free encyclopedia. |
|
Economies of scale for all manufacturing. From 1950 t0 2004 manufacturing workers dropped from 35 percent of the labor force to 13 percent. Yet production went up dramatically.
|
| VII. Long run costs by industry, a dynamic models | ||||||||||||||||||||||||||||||||||
|
A.
constant-cost industry from
amosweb, a leader
in economics education
B.
decreasing-cost industry |
|
|||||||||||||||||||||||||||||||||
|
F.
Business Are Doing More With Less Workers as hiring has not com back
after the last three recessions
|
|
|||||||||||||||||||||||||||||||||
|
G. Fracking, which lowers cost, could a Game Changer for U.S. Manufacturing Until Russia Entered the Supply Market.
|
|
|||||||||||||||||||||||||||||||||
|
H.
Incremental cost of labor
|
||||||||||||||||||||||||||||||||||
|
Source Click |
Largest Advanced Manufacturing Firms by Revenue
SOURCE: Compustat. See unit_strategy_value_creation_growth_when_asset_light_is_right/?chapter=2 |
|||||||||||||||||||||||||||||||||
|
VIII.
Robot Revolution
(a) Economists and others grapple with these issues (this section will be updated):
(b) Martin Ford has some answers to these questions:
Ford wrote
The Lights in the Tunnel: Automation, Accelerating Technology
and the Economy of the Future (2009);
(c) Posts about the robot revolution:
|
||||||||||||||||||||||||||||||||||
k