Economics Exposed!
Editor's Comments in Red

Return to Current Political Economy Issues   Updated 12/1/20      Please link to, use to educate and share.   
 

1. Monetary Policy Often Doesn't Work

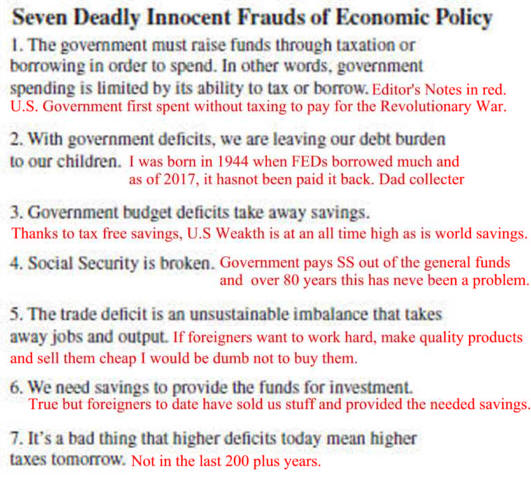
4. Seven Deadly Economic Policy Frauds

2. Misuse of Inflation Data, Allowed and Causes Unwarranted Problems

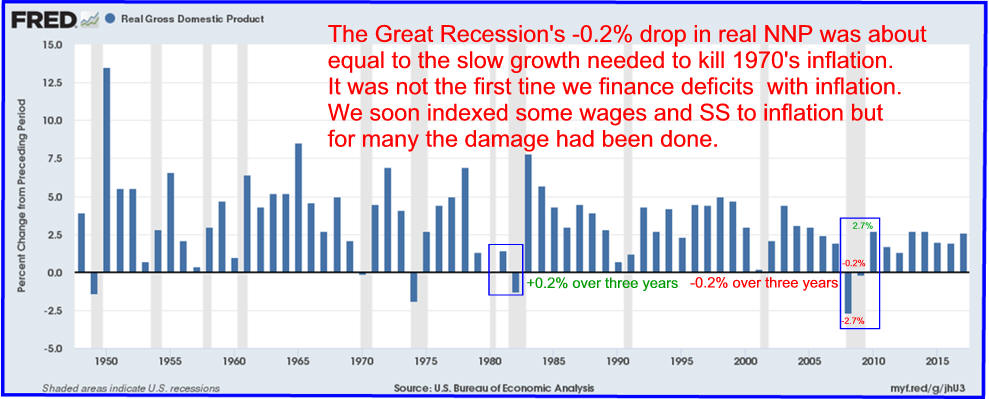
3. Was the Great Recession Really Great?

5. A New Cycle Changes Everything

6. Why Poverty is Controversial?   

7. Humanity Getting Better?

   8. Did Lowest Income Quintile Stagnate 1989 to 2015? 
   

9. Some People Continue To Believe Stupid Economic Ideas?

  40 min video 4/17 Mark Blyth

               
10. Economics Rules:
The Rights and Wrongs of the Dismal Science
LSE 11/09/15

1. Fine Tuning Monetary Policy
Usually Doesn't Work

" ...we do not... have a theory of inflation dynamics that works sufficiently well to be of use for the business of
 real-time monetary policy-making."

Daniel Tarullol
-Monetary Policy Without a Working Theory of Inflation
Greenspan almost fooled all of the people all of the time! 


When Economists Ignore the Human Factor
 and  We All Pay the Price

"...economists too often assumed that market actors not only behave rationally but do so according to the same mental models deployed by economists. Modern macroeconomics also  minimized affects of the financial system."

Mathematical Economists adjusts by accepting Behavioral Economics
which made economic models Even More Useless.

Liars, extreme liars and statisticians
applies to economists and politicians.

Quiet Death of Fundamental Economic Principle

2. Misuse of Inflation Data Allowed and
    Caused Unwarranted Problems

  
A. Three Inflation Measures Support Many Prejudices

     1. CPI Adjusted Index-Chart is Red
        a) Adjusts for seasonable differences
        b) Under estimates income change source
        c) Used by people wanting quickly updated data
        d)
Used to grow support for government programs

     2. Data supports almost all economic philosophies.


2. CPI-U-RS Adjusted-Chart is Blue   
      a) Measures urban purchases which is more realistic
      b) It does not incorporate all possible data on past inflation. 
      c) For example, no attempt made to reflect any new information
        on trends in the safety or comfort of air travel for which there

        is no corresponding methodological change in the CPI-U. bls.gov
 
3. PCE A Index-Chart is Green reflects "consumer substitution"
     is difficult to implement in real time.
     a) Measures buying of economic shoppers 
     b. When oranges are really expensive substitute bananas
         or grapefruit.
        
 
4.
Problems With Economic Measurements Over Time 5 min video

Poor Live Better since 1989


The
Good Old Days Were Expensive

1964 TV's Were Really Big and Really Expensive

Today's TV Screens are Bigger, Set Is Smaller With a Much Better Picture and Look at All the Extra Stuff You Get Today!

global-marketplace-magic, the-miracle-of-global-manufacturing, christmas-1964-vs-today


Was the Great Recession Really Great?


Read the Book:
by W. Moster


W. Moster lecture 
62 min.

Video Interview
with M. Moster

The Euro: past, present and future. The Crossroads Workshop 42 min. video

Moster's hypothesis
is dependent upon U.S.

Exorbitant Dollar Privilege.

Interesting Quotes

"If you insure [banks] you had better regulate [banks] otherwise banks have no skin in the game."

Concerning pro cyclical policies "Its fine on the way up"


A New Cycle Changes Everything?
Last 65 Year Cycle Helped Many, Hurt Many


Why is Poverty Controversial?
Liars, Dame Liars and Economists


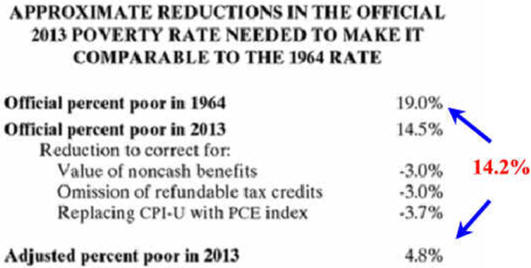
Poverty Down Only 4.5% Points Over Fifty Years


Poverty Down 14.2% Points Over Fifty Years 

See War on Poverty, Was it Lost? NYT Legacies of the War on Poverty by Martha J. Bailey (Editor), Sheldon Danziger (Editor)

This chart "...provides a first approximation of how correcting the 2013 poverty rate for noncash food and housing benefits, refundable tax credits, and not using the upward [inflation] bias of the CPI-U would change the 2013 poverty rate. This adjusted poverty rate falls from 14.5 to 4.8 percent, making the 2013 rate roughly a quarter of the 1964 rate (19.0 percent). If we were to lower the poverty threshold for cohabiting couples to match that for married couples the 2013 poverty rate would have fallen even more." Examples of noncash benefits include food stamps SNAP), discounted school lunches, subsidized rent, Medicaid, and Medicare. See Source Editors Comments are in red. Editor' Note:
Economists stay employed by giving two answers, 16% for liberals and 4.8% for conservatives.
For more concerning poverty visit  Current U.S. Political Economy Controversies


Did Lowest Income Quintile Stagnate 1989 to 2015? 
Q1 Closed 47% of the Absolute Gap With Q2 in One Generation.
Using a relative measure the bottom can't ever catch up.
Closing the Relative Gap Would Mean Equalizing Income 
which Russia tried from 1919 to 1980   Return to Top

Income Quintiles Inflation-Adjusted Expenditures

Income Group

Year

Quintile Income Gain
(P2015 - P1989)

 Gap 1989
Q Higher
 - Q Lower

 Gap 2015
Q Higher
 - Q Lower

1989
P1

2015
P2

Q1 Bottom 20 Percent

$20,296

$24,622

24,622 - 20,296 = $4,326


Q2 Second 20 Percent

$29,561

$35,529

35,529 - 29,561 = $5,968

29,561- 20,296 = $9,265

$10,907

Q3 Middle 20 Percent

$41,223

$46,363

46,363 - 41,223 = $5,140

41,223 - 29,561 = $11,662

$10,834

Q4 Fourth 20 Percent

$57,612

$64,381

64,381 - 57,612 = $6,769

57,612 -41,223 = $16,389

$18,018

Q5 Top 20 Percent

$89,443

$111,633

111,663 -89,443 = $22,190

89,443-57,612 = $31,831

$46,,802

Humanity Getting Better 1:29 video

See Economic Future of Our Children and Are Children & Young People Protected?
 

Please      Comments to antonw@ix.netcom.com


Is_Time_to_Take_More_from_the_Top_1/10_of_1%___