
Financial Bailouts, Economic Recovery, Poverty Stuck at 15%, Profit vs. Labor, Wellbeing Grows, Asian Competition
|
Financial Bailouts, Economic Recovery, Poverty Stuck at 15%, Profit vs. Labor, Wellbeing Grows, Asian Competition |
|
New Normal # 4 U.S. Bailout History The $700 billion 2008 financial-sector rescue plan is the latest of many bailouts that go back to the Panic of 1792 when the federal government bailed out states over-burdened by their Revolutionary War Debt. Thereafter private banks and investment bankers took over financial bailouts until the Panic of 1907 when the economy was so big that even J.P. Morgan needed U.S. Treasury help. This led to the 1913 Federal Reserve System designed to be the lender of last resort. |
Recently the 1987 Savings and Loan Crisis bailout cost about $160 billion. Other recent government private sector bailouts have included: 1970 Penn Central 1971 Lockheed 1980 Chrysler 1984 Continental Illinois 1991 Executive Life Insurance Company by states assessing other insurers and the 1998 Long-Term Capital Management bailout by commercial and investment banks. See History of U.S. Government Bailouts. Think overcoming greed is difficult. U.S. does better than most! 12/28/15 Use pdf for color printing. |
|
|
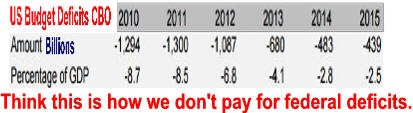
Great Recession Cost Were High But Growth Cured Budget Problems Economic Cost of Great Recession Estimated at 12.8 Trillion. Some add home values loss but this is a reach since the housing bubble had inflated values. U.S. FED Profit of $100b in 2014 was up from $47b in 2009. The 2010-14 total was $ 420b. Source |
 |
 |
See
Treasury
Financial Analysis of Great Recession in Charts.
More Shenanigans Coming? |
 New Normal # 5 Poverty Stuck at 15% Some believe the 15.5% poverty rate should be lowered. After "...correcting the 2013 poverty rate for noncash food and housing benefits, refundable tax credits, and the upward bias in the CPI-U ..."the rate drops from 14.5% to 4.8%. War on Poverty-Was It Lost Others believe it should be raised as it doesn't account for geographic and demographics differences. See Poverty Rates How Flawed Measure Drives Policy Other Data 1 Data 2 Think many use true but not necessarily appropriate data to foster their POLITICAL beliefs. Example: With our obesity problem how could anyone have believed that many went to bed hungry during the Great Recession. Calculation ignored food stamps and subsidized school lunches. |
||
|
|
||
|
New Normal #7
|
1. Society's continued stability has resulted in tremendous economic growth
which is
the key determinate of well-being.
Public safety net,
child
safety, and
adjusted poverty rate have all improved
dramatically since the
Gilded Age. Think
economic continued economic distress in
Russia, Europe, Japan and China. 2) Scientific achievements have continuously added to citizen well-being. Think cured diseases, smart phones, streaming audio-video, Gillette Stadium ... See Health Problems Solved. 3) Personal Income increased continuously if not always rapidly because nature and nurture improved the personal characteristics needed to enhance wellbeing. Think Russia, China, and Europe's really slow recovery from the Great Recession. Source Is The Country In Trouble, Will Stagnate Income Hurt Our Children and Recent Decades Ranked By Problems. see Crisis of Capitalism 11:10 video is an interesting Marxian view i.e. Bernie Sanders Return to page 1 Send thoughts to antonw@ix.netcom.com |
New Normal # 8 Asian Competition
|

 New Normal # 6
Profit
Beating Labor Twenty-first century war expenditures helped profit recover after a
New Normal # 6
Profit
Beating Labor Twenty-first century war expenditures helped profit recover after a

