|
|
Can U.S. Federal Government Afford a $20 Trillion Debt? |
|||||||||||||||||||||||||||||||||||||||||||||||||
|
2. Recent War Debt Has Not Dropped 3. Is Private Debt More of a Problem? |
7. Debt Has Been Higher So Why All Static? 9. Tax System Benefits Everyone
Return to
Economic Issues
|
|||||||||||||||||||||||||||||||||||||||||||||||||
|
|
||||||||||||||||||||||||||||||||||||||||||||||||||
|
|
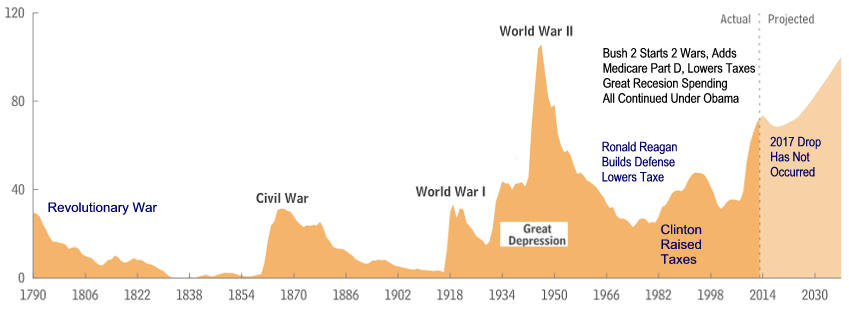
2. Recent War/Recession Debt
Continues to Increase
|
|||||||||||||||||||||||||||||||||||||||||||||||||
|
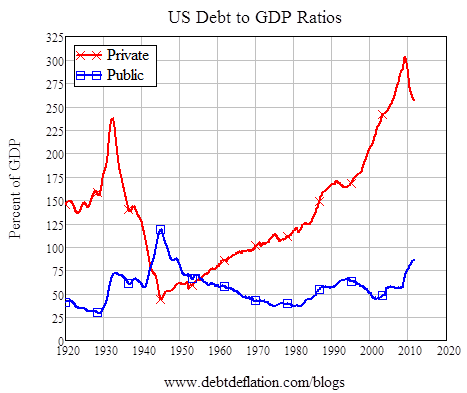
3. Is Private Debt More of a Problem?
|
||||||||||||||||||||||||||||||||||||||||||||||||||
|
4.
Entitlements Are
Going Up Though Not Guaranteed
Editor's Notes:
Higher Interest Rates Could Make
Carrying Debt More Expensive Health Costs Continue Up
|
||||||||||||||||||||||||||||||||||||||||||||||||||
|
A New Entitlement Law Would Keep Cash Flow Positive
Source
|
||||||||||||||||||||||||||||||||||||||||||||||||||
|
7. Debt Has Been Higher So
Why All Static? Vice
Versa |
||||||||||||||||||||||||||||||||||||||||||||||||||
|
Spending Up 4%, Tax Revenues Down 4% Deep Do Do Resulted
9. Tax System Benefits Everyone Market Income Plus Transfer Payments and Minus Federal Taxes
Return to
Economic Wellbeing |
||||||||||||||||||||||||||||||||||||||||||||||||||
|
More Data |
||||||||||||||||||||||||||||||||||||||||||||||||||
|
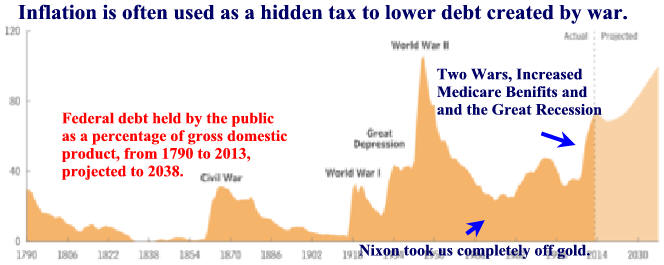
Low Inflation is Stalling Debt Reduction
Inflation when added to growth makes our country's debt like any mortgage smaller over time. Editors Note: My 1977 mortgage of $250 seemed a burden but within a few years inflation from the second oil embargo and a better job grew my salary so the mortgage became insignificant. The controlled inflation since 1985 seems to be the good for the economy and the current deflation puts those paying debt in Deep Doo Doo!
|
||||||||||||||||||||||||||||||||||||||||||||||||||
|
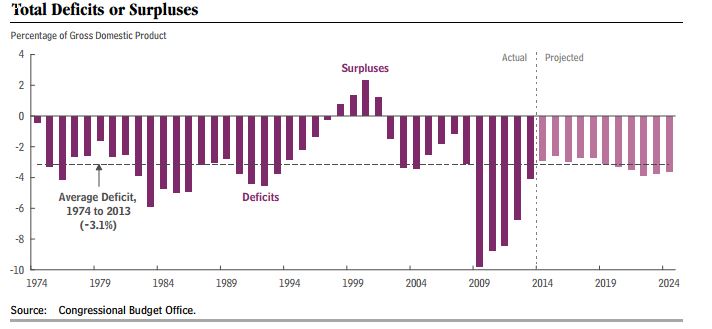
Annual Federal Deficit is Back to Normal
|
Who Will Pay the Current Debt?
|
|||||||||||||||||||||||||||||||||||||||||||||||||
|
Who Owns the Debt?
|
Editor's Note: Historically "Great Powers" have declined because of excess debt caused by military expenditures which not paid for by taxes. Today the U.S. adds extensive health care spending debt to the mix. Inflation has historical cured debt problems by lowering its relative to the nation's productivity poorly measured by GDP. This is happening today. Historically high interest payments caused by large debts have been a problem but today's excess world savings is keeping interest rate low allowing not only low interest payments but low interest rate debt refinancing. This lower real relative U.S. debt and low interest payments should ease the fears of some older Americans who are concerned over the financial Personally, as a college educated 72 year-old with a 13 year life expectancy; I would gladly accept higher deficits for another ten years of healthy living. Then I would be a happy, somewhat poorer, and still good-looking ninety-five year-old crotchety old-man. The easiest debt cure is account for people living longer. It would increase the ages for early SS retirement, the receipt of full SS retirement benefits and the receipt of Medicare. Next is an increase Medicare payroll tax rate for high earners who are living much longer. Last is an increased income base for Social Security. Others debt cures include larger health care deductibles, less military spending made possible by requiring Japan and South Korea to handle more of the perceived threat from the Chinese military and NATO nations living up to their 2% of GDP commitment. For me the soundness of Social Security and Medicare is not much of a problem but these Unfunded Government Liabilities may prove a problem for our children and grandchildren if we continue to delay an increase in payroll taxes.
Return to Election Issues 2016 2/17/16 |
|||||||||||||||||||||||||||||||||||||||||||||||||
|
Subtracting
Federal Debt Owed to Itself
|
||||||||||||||||||||||||||||||||||||||||||||||||||