Political Economy Debate Data

Please 

1. Why is Poverty Controversial?
    A. Which Poverty Data is Correct?
    B. Is Enough Done for the Poor?
2. Is Income Stagnation Serious? 
 

3. Is Politics About the Money?
4. Worst 20th Century Decade Was?
5. Criticism of Modern Capitalism
6.
Market Capitalism Political Economy Videos   

A. Which Poverty Data is Correct?

Poverty Down Only 4.5% Points 
Over Fifty Years

Poverty Down 14.2% Points 
Over Fifty Years 


See War on Poverty, Was it Lost?
     Legacies of the War on Poverty

Editors Comments are in red.

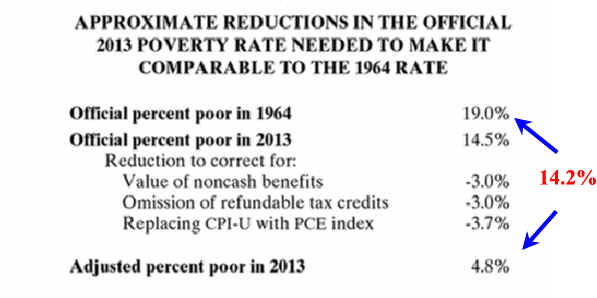
This chart "...provides a first approximation of how correcting the 2013 poverty rate for noncash food and housing benefits, refundable tax credits, and upward [inflation] bias in the CPI-U would change the 2013 poverty rate. With these corrections the official poverty rate falls from 14.5 to 4.8 percent, making the 2013 rate roughly a quarter of the 1964 rate (19.0 percent). If we were to lower the poverty threshold for cohabiting couples to match that for married couples the 2013 poverty rate would have fallen even more." Examples of noncash benefits include food stamps SNAP), discounted school lunches, subsidized rent, Medicaid, and Medicare. See Source


Picture

source federal safety net.com

Liars, Dame Liars and Statisticians

This data shows a tremendous increase in spending on our safety net but there are two problems. First, total spending is not adjusted for inflation which has been was very high in the 1970's and high the rest of the century. Using appropriate techniques yields a drop in poverty to 4.8%.

The More Relevant Question is

Why isn't the CBO providing basic data using appropriate methods to judge the specific questions related to this and other issues. The CPI-U is an all-purpose index that is often inappropriately used.


Average State Spending 
Per Poor Person

Spending Per Capita and Per Poor Person on Different Types of Social Welfare Functions, Averages for Fiscal Capacity Quartiles, 1977-2000, Average spending per poor person

Source is extensive and indicates the 
Q4 poorer states are in the south an North-West.


Editors Note:
People that really annoy me are those on either side of an issue that know they are using misleading statistics but continue for the personal gain that results. Others do so because of human prejudice for a particular idea and this is difficult to control. 

And the Answer Is? U.S. Government Defined Poverty from Distributing Income may help with your answer.

A Relevant Question How has the lifestyle and well being changed for the bottom decile?

Please e-mail suggestions to antonw@ix.netcom.com


state.taxes.and.inequality Another Relevant Question

What if people reporting all these people especially children who are supposedly staving are basing there numbers on the official rate that does not include food stamps and help paying for school   lunches? Do you think they do it so you will donate to their nonprofit program to help the poor? To get elected? Have you ever checked out salaries at guidestar.org.


See For Poorer and Richer NYT 3/14/15