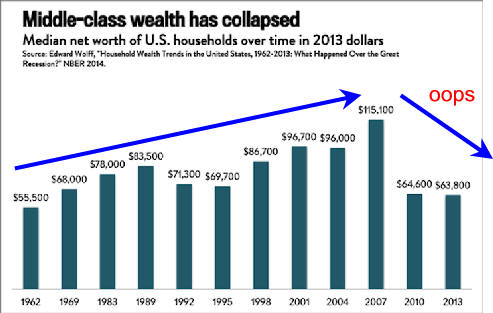
Is Middle Class Wealth Fall a Crisis?
Questions/Comments to antonw@ix.netcom.com
Updated 7/15/19  Please link to, use to educate and share.

1. Class Structure Must Be Defined     2. Recent Income and Wealth Distributions

3. Home Ownership: Entry Into Middle Class     4. Since 1917 Extremes Got More GDP Pie

5. Middle Class Share Declined     6. Has Safety Net Adjusted Enough?

7. Analysis Will Trump's Trickle  Down Work?     8. Middle Class Economics (textbooksfree.org)

Discussions Questions

Where Have All the Good Jobs Gone?  Will Inflation/Growth Solve Pay Deficit?  Will Debt Bring Down US Capitalism?


Data

Source  See  The Great Recession Casts a Long Shadow on Family Finances


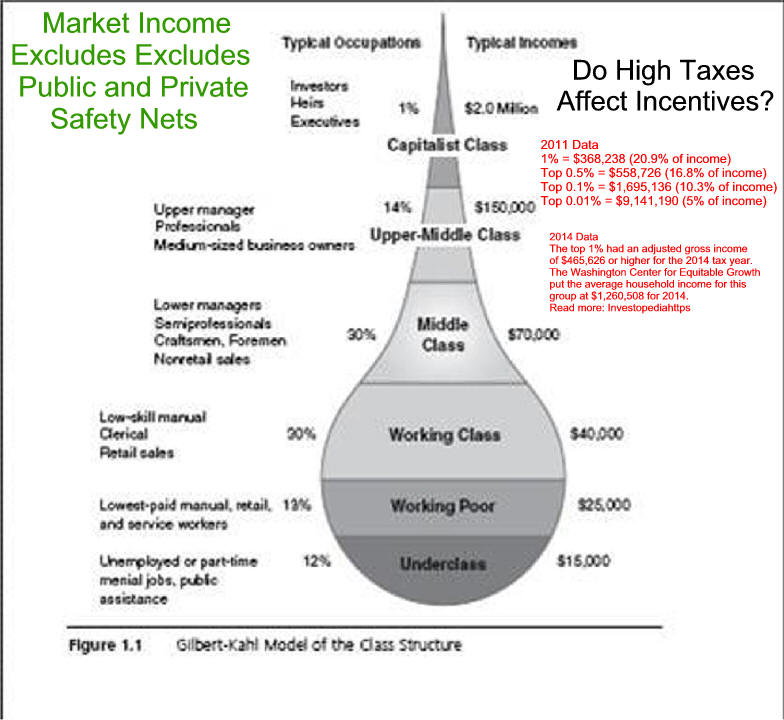
1.Class Structure Must Be Defined

 
Upper Aristocracy, Really Wealth People
Upper Middle Very Successful Professionals and  Business Owners
Middle Middle Successful Professionals and  Business Owners
Lower Middle Low Paying White Collar Service Workers
Lower Laborers, Part Time and Unemployed


Source   See Forget the top 1% — Look at the top 0.1% and How Much Income Puts  You in the Top 1%, 5%, 10%?


2. Recent Income and Wealth Distributions

From Wolff (2014); only mean figures are available, not medians. 
Note that income and wealth are separate measures;  so, for example, the top 1% of income-earners is not exactly the same group of people as the top 1% of wealth-holders, although there is considerable overlap.  Source Wealth, Income, and Power by G. William Domhoff is extensive.
See
The Numbers Game: How's The Middle Class Doing
 

Table 1: Income and net worth in the U.S. by class, 2013 Editors Note: Mean is Higher than Median
vv
  Mean household income Mean household net worth
Top 1%

Upper Class
 

$1,679,000

$18,623,400
Top 20%

Upper Middle
$257,200 $2,260,300 Upper Middle

60th-80th%

Middle Middle
$76,500 $236,400

40th-60th%  

Middle Middle
 

$46,000

$68,100
Bottom 40%

Lower Middle

Lower Class
 

$20,300


-$10,800


Current Discussion on the wellbeing of the "middle class is about this group

though most people consider themselves "middle class!


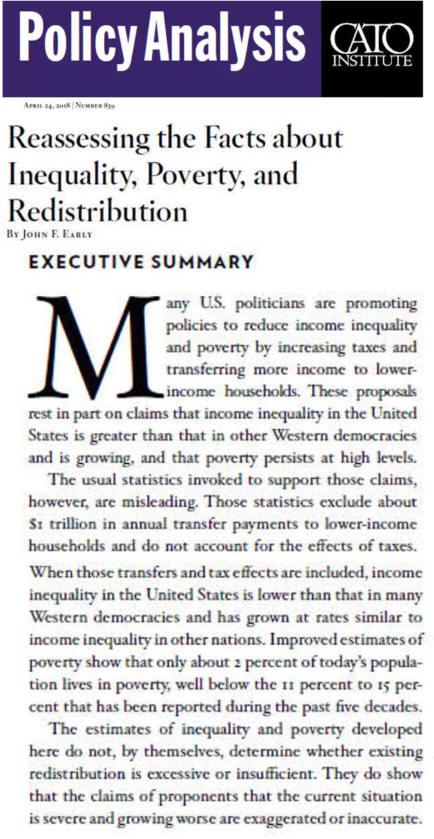
Reassessing the Inequality, Poverty,
and Redistribution

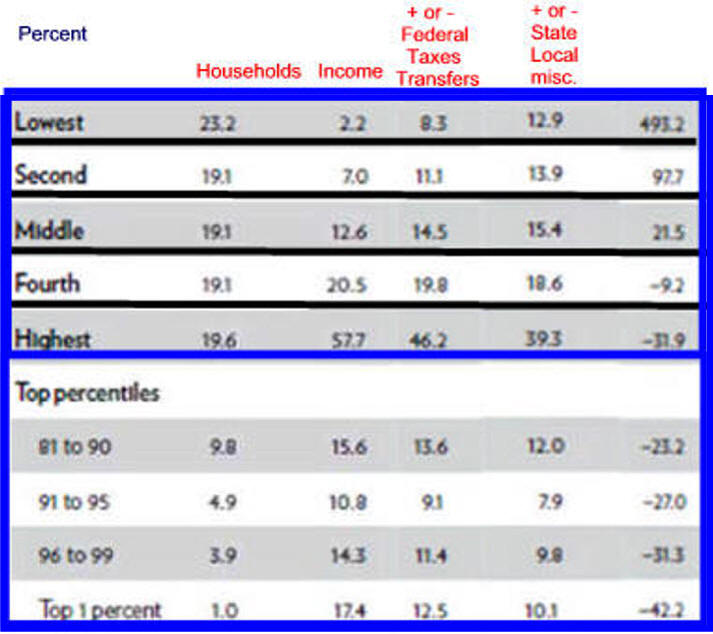
Income Adjusted for Governments Quintile

Bottom rose 2.2%-12.9%


Second rose 7%-13.9%


Third
rose 12.6%-15.4%


Fourth 20.5% to  18.6%

Top quintile share fell 57.7% to 39.3%.

Top to bottom multiple

dropped from 26 times to three times

In addition work effort increased moving up the

income ladder as more family members worked

and more worked two jobs. Calculations

Editors Note: Top 1% Got the Most!

Original Source 


3. Home Ownership: Entry Into the
Middle Middle Class


Historical Homeownership Rate 1890 through 1970
Note: Home ownership stayed at  about 45% until WW2 pushed it to 60%
This was a major increase and it created the Middle Middle Class


Homeownership Rate
Early Years

1890 47.80%
1900 46.70%
1910 45.90%
1920 45.60%
1930 47.80%
1940 43.60%
Homeownership Rate
1945 WW2 Prosperity 53.20%
1950 VA Loans 55.00%
1956 60.40%
1960 61.90%
1970 62.90%
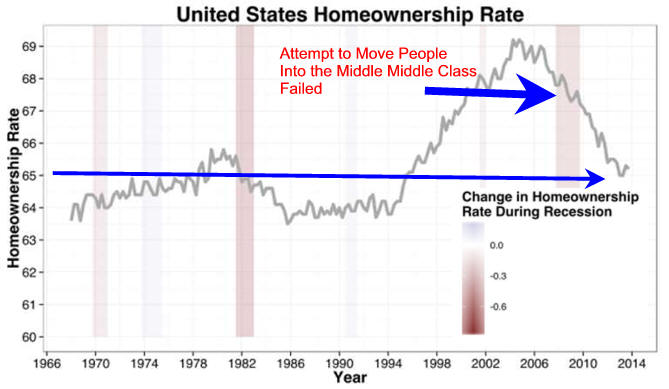
Attempts Beginning With Clinton Worked 
Then Collapsed
Because of Financing and Real Estate Abuse!


Political Efforts to Failed

Source  See Causes of the Great Recession


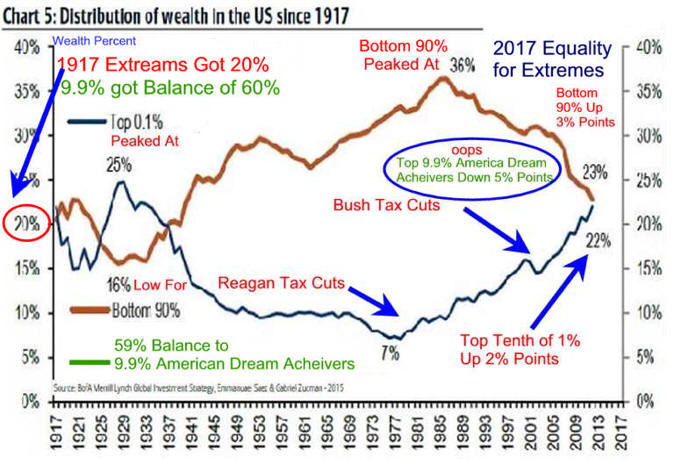
4. Since 1917 the Extremes
Got More Economic Pie

Urban Institute Believes Upper Middle Class is the Big Winner
See
The Growing Size and Incomes of the Upper Middle Class
6/16


5. Middle Class Share of Income Declined


6. Has Safety Net Adjusted Enough?


Source

Editor's Note:

A similar analysis adding the present value of Medicare and Social Security
to welath would be interesting.

Trump Voters looked out the window, saw the giveaway,
new many got more than them and voted accordingly.


7. Analysis Will Trump's Trickle  Down Work?
If Not, 3 Deep Do Do
Too early to measure.
The chart below is one criteria
See
Middle-Class Plight

Data Overkill Excepts for Nerds!

 
  incomea2014