Long-Term Testing Results
Are America's Students Learning Less?

Today’s 9-and 13-year-old students scored higher in reading and mathematics
 than their counterparts did 40 years ago according to The Nation’s Report Card:
Trends in Academic Progress 2012, a long-term trend assessment designed to track achievement
 of students ages 9, 13 and 17 since the 1970s.
However, 17-year-olds did not show similar gains.
Sources
Return to textbooksfree.org/Education Libraries


Reading Scores

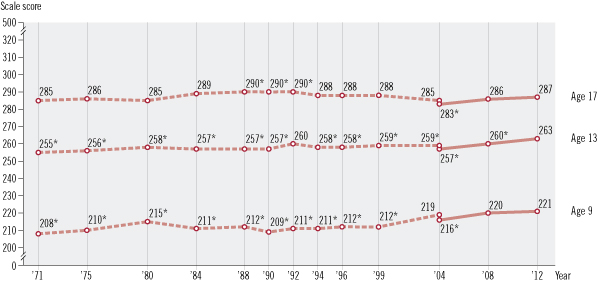
Image of a line graph with three horizontal lines showing average scores for age 9, age 13, and age 17 students. The X axis is labeled year and shows various years from 1971 through 2012. The Y axis is labeled scale score and shows a range of scores from 0 to 500. Each horizontal line consists of two assessment variations: original assessment format and revised assessment format. 
      There are two data points in the transition year between original and revised formats. 
      For Reading age 9: The original format was used, In 1971 = 208, significantly different from 2012; 
      In 1975 = 210, significantly different from 2012; In 1980 = 215, significantly different from 2012;
       In 1984 = 211, significantly different from 2012; In 1988 = 212, significantly different from 2012; 
       In 1990 = 209, significantly different from 2012; In 1992 = 211, significantly different from 2012; 
       In 1994 = 211, significantly different from 2012; In 1996 = 212, significantly different from 2012; In 1999 = 
       212, significantly different from 2012; In 2004 = 219; The revised format was used, In 2004 = 216, 
       significantly different from 2012; In 2008 = 220; and In 2012 = 221. For Reading age 13: 
       The original format was used, In 1971 = 255, significantly different from 2012; In 1975 = 256, 
       significantly different from 2012; In 1980 = 258, significantly different from 2012; In 1984 = 257, 
       significantly different from 2012; In 1988 = 257, significantly different from 2012; In 1990 = 257, 
       significantly different from 2012; In 1992 = 260; In 1994 = 258, significantly different from 2012; 
       In 1996 = 258, significantly different from 2012; In 1999 = 259, significantly different from 2012;
        In 2004 = 259, significantly different from 2012; The revised format was used, In 2004 = 257, 
        significantly different from 2012; In 2008 = 260, significantly different from 2012; and In 2012 = 263. 
        For Reading age 17: The original format was used, In 1971 = 285; In 1975 = 286; In 1980 = 285;
         In 1984 = 289; In 1988 = 290, significantly different from 2012; In 1990 = 290, significantly different from 2012; In 1992 = 290, significantly different from 2012; In 1994 = 288; In 1996 = 288; In 1999 = 288; In 2004 = 285; 
         The revised format was used, In 2004 = 283, significantly different from 2012; In 2008 = 286; and In 2012 = 287.

Mathematics Scores

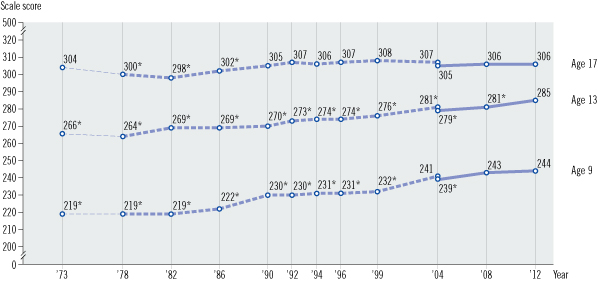
Image of a line graph with three horizontal lines showing average scores for age 9, age 13, and age 17 students. The X axis is labeled year and shows various years from 1973 through 2012. The Y axis is labeled scale score and shows a range of scores from 0 to 500. Each horizontal line consists of three assessment variations: original assessment format, and revised assessment format, and extrapolated data. There are two data points in the transition year between original and revised formats. For Mathematics age 9: The scores were extrapolated In 1973 = 219, significantly different from 2012; The original format was used, In 1978 = 219, significantly different from 2012; In 1982 = 219, significantly different from 2012; In 1986 = 222, significantly different from 2012; In 1990 = 230, significantly different from 2012; In 1992 = 230, significantly different from 2012; In 1994 = 231, significantly different from 2012; In 1996 = 231, significantly different from 2012; In 1999 = 232, significantly different from 2012; In 2004 = 241; The revised format was used, In 2004 = 239, significantly different from 2012; In 2008 = 243; and In 2012 = 244. For Mathematics age 13: The scores were extrapolated In 1973 = 266, significantly different from 2012; The original format was used, In 1978 = 264, significantly different from 2012; In 1982 = 269, significantly different from 2012; In 1986 = 269, significantly different from 2012; In 1990 = 270, significantly different from 2012; In 1992 = 273, significantly different from 2012; In 1994 = 274, significantly different from 2012; In 1996 = 274, significantly different from 2012; In 1999 = 276, significantly different from 2012; In 2004 = 281, significantly different from 2012; The revised format was used, In 2004 = 279, significantly different from 2012; In 2008 = 281, significantly different from 2012; and In 2012 = 285. For Mathematics age 17: The scores were extrapolated In 1973 = 304; The original format was used, In 1978 = 300, significantly different from 2012; In 1982 = 298, significantly different from 2012; In 1986 = 302, significantly different from 2012; In 1990 = 305; In 1992 = 307; In 1994 = 306; In 1996 = 307; In 1999 = 308; In 2004 = 307; The revised format was used, In 2004 = 305; In 2008 = 306; and In 2012 = 306.


Will Covid Effect Be Temporary?


Editorial: Education Reform could be one answer?

See Massachusetts PISA Education Test Scores Were Great or Were They?

Sources

National Assessment of Education Progress press release

Nation's Report Card has the test scores

Long and Short Term Difference.