Suggested by Christian Zimmermann.

Does Income Inequality Affect Economic Growth?
Return to
Current Political Economy Issues
Updated 8/16/18
Please link to,
use to educate and share.
|
Does Income Inequality Affect Economic Growth?
Return to
Current Political Economy Issues
|
|
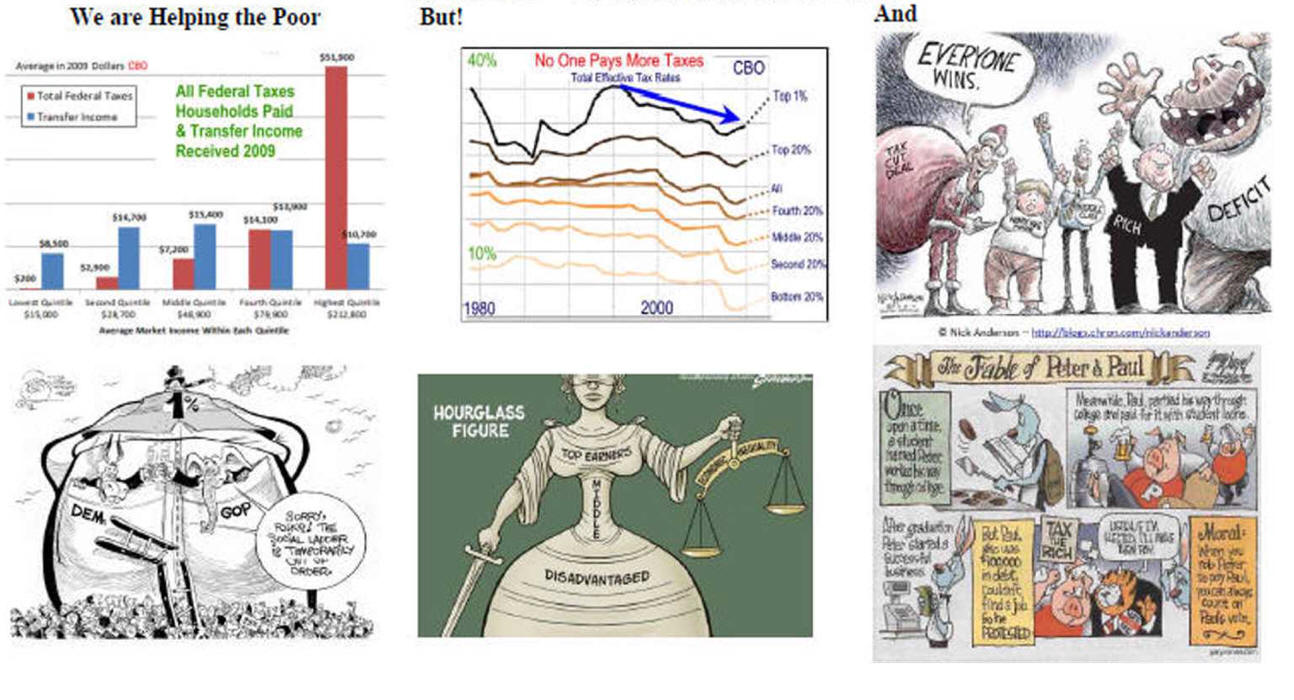
At some
point, Business Takes Too Much, Growth Slows, and Politics
Becomes Unstable
|
||
|
Growth is Still Increasing, Inequality Is Up, Is a Turn Coming?
|
||
|
|
||
|
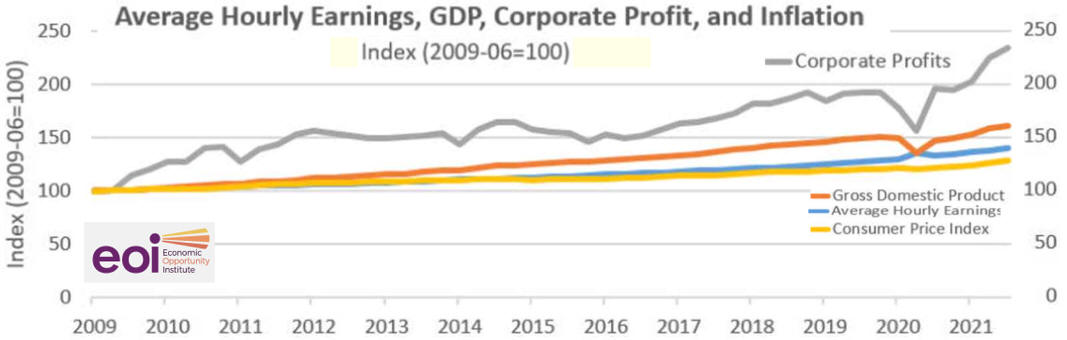
This FRED graph shows the
evolution of two sources of
income in our national
economy: the compensation of
employees through wages and
other salary compensation, and
the compensation of capital
through profits. Both series
are adjusted for inflation and
both start at the level of 100
in 1954, which is the first
year that’s considered
“post-war” for economic
purposes. (NOTE: The economic
impact of the Korean War has
essentially vanished.)
Eyeballing the data leads to
two major conclusions. First,
corporate profits move a lot,
especially in response to
general business activity.
Profits tend to tank during
recessions (noted with gray
bars), which is
understandable. After all,
it’s well understood that
investing in a business is a
risky undertaking that
deserves and often acquires
compensation. Employee income
is much more stable, but still
suffers during recessions. Second, the trends of the two series tend to track each other over several decades, reflecting the general growth of the economy. The past decade and a half seems to be different, though Never have corporate profits outgrown employee compensation so clearly and for so long. Is it because there’s been a particularly risky climate for investment, or is something else afoot? How this graph was created From the release table about national income by type of income, check the two series and click on “Add to Graph ” From the “Edit Graph” panel, add a series by searching for and selecting “GDP deflator,” apply a and finally set the index value of 100 to 1954-05. Repeat for the second line. Suggested by Christian Zimmermann. |
|
Liberals Want More Redistribution, Conservatives Not So Much