Lecture Notes 1-page printable lecture notes
I
Introduction
|
Unit 1 Review Elasticity measures the effect price changes on quantities purchased
III. Graphic Interpreting of Elasticity A. At the Extremes Elasticity measures reaction to price. Elastic is flat, quantity changes more, Inelastic is steep, quantity changes less.
|
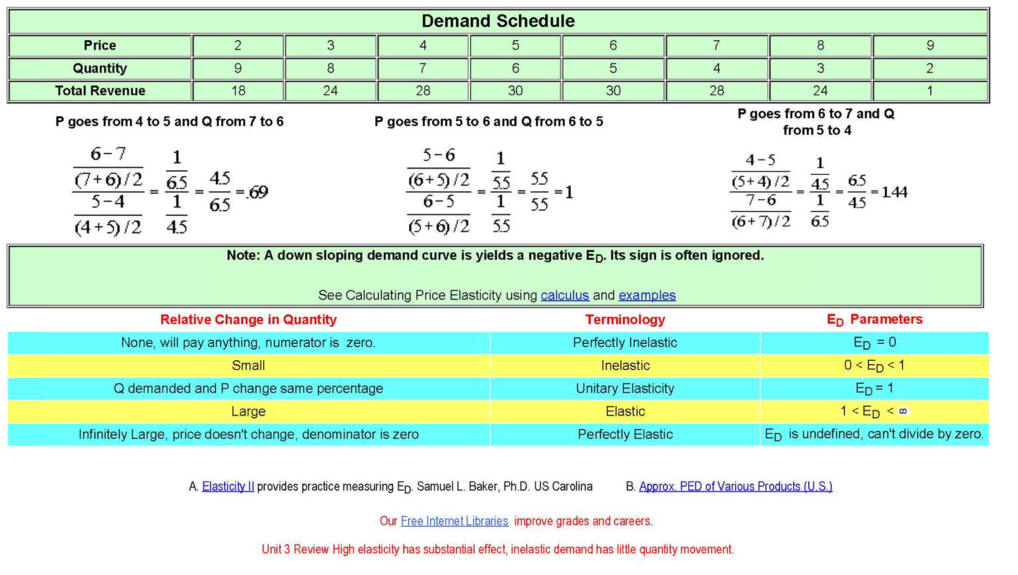
B. Total Revenue derived from a Linear Demand Curve
|
IV. The Total Revenue Test
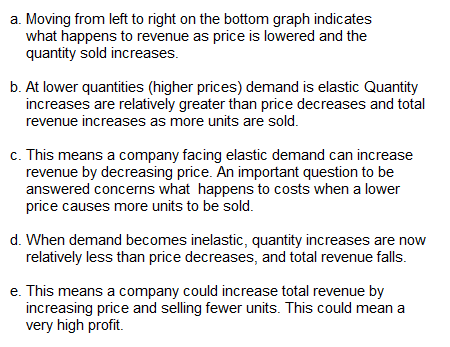
A. When demand is elastic, price and total revenue move in the opposite direction. B. When demand is inelastic, price and total revenue move in the same direction. C. Total Revenue Test Video has a graphic explanation. D. Welker Video Elasticity &Total Revenue |
|||
Elasticity of Demand and Total Revenue |
|||
Elasticity |
When Price Increases |
Total Revenue |
|
ED >1 |
Somewhat Elastic | Quantity Changing a Lot so a lot of revenue could be lost. |
Decreases |
ED = 1 |
Unitary Elasticity | Quantity/Price Changing Same % |
No Change |
ED <1 |
Somewhat Inelastic | Quantity Changed Little so a lot of revenue could be gained. |
Increased |
Unit 5 R With elastic demand p and TR move in opposite
directions, Inelastic the same direction
We need to
understand cost production to understand making a profit. |
V. Determinates of Demand Elasticity 6 minute video | ||
Product Characteristics | Elastic Demand | Inelastic Demand |
Number of substitutes | Many | Few or none |
% of purchaser's budget | High | Low |
Type of good | Luxury | Necessity, Emergency |
Desire | No hurry | Required quickly |
Examples | Steak, Vacations | Salt, Bread |
Unit 6 Review Substitutes, price,
necessity or luxury, budgets position determine elasticity |
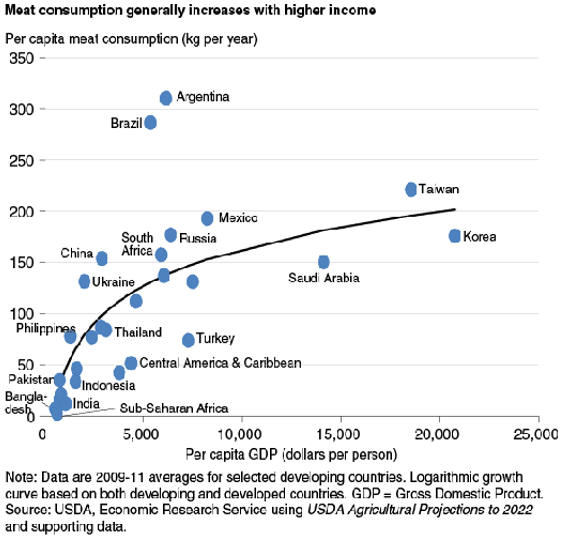
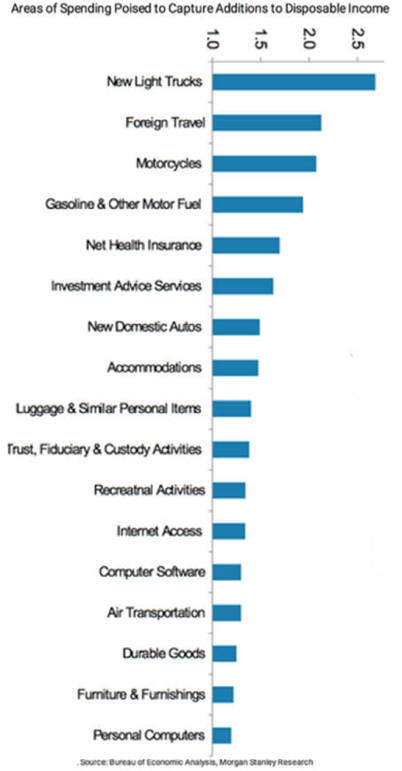
VI. Income Elasticity of Demand is the % change in quantity demanded divided by the % change in income.
A. Income elasticity is positive for normal (superior)
goods such as steak |
|
VII
. Cross elasticity
of demand
is the % change in quantity demanded divided by the % change in the price of a substitute or complement. A. Cross elasticity is positive for goods that are substitutes (price of hot dogs up, quantity of hamburger sold up). B. It is negative for goods that are complements (price of hot dogs up, quantity of hot dog rolls sold down). C Near zero for independent goods (peanuts and grapefruit) C. Cross Price Elasticity of Demand from tutor2u D. Income and Cross Elasticity Video from ACDC Econ E. Low cross-price elasticity of demand means there's no incentive to vote for more California housing 2/19/19 F. Virtual Economy from Buz\ed has an elasticity calculator. Please Share |
VIII.
Applications A. Various research methods are used to calculate price elasticity: 1. Test marketing 2. Analysis of historical sales data B. Example 1 1. Slave Redemption and Elasticity 1 2. Slave Redemption and Elasticity 2 C. Applied Elasticity of Demand 4 min video D. Selected income elasticity's 1.View a table containing elasticity of demand approximations s 2. Income elasticity's are notably stable over time and across countries. 3. Could Price Elasticith be Increasing? in our more competitive world
E. Price Elasticity and Government Actions 1. High farm yields for crops with an inelastic demand cause farmers to lose money as people don't eat a lot more so we have a federal farm program. 2. Excises taxes increase price so the governments puts them on inelastic goods like tobacco, alcohol, and jewelry. a. Drugs could be next and profit will be determined by price elasticity of demand for drugs (How Inelastic is it?), law enforcement savings, and the cost of helping new addicts? b. Econ Concepts in 60 Seconds Analyzing Excise Tax Practice c. Why It's Obvious We are losing the war against drugs d. Elasticity and the Price of Gasoline e. Elasticity of Demand for Higher Education f. Price Elasticity of Demand at a Private University
|
F. Tax
Incidence Effects
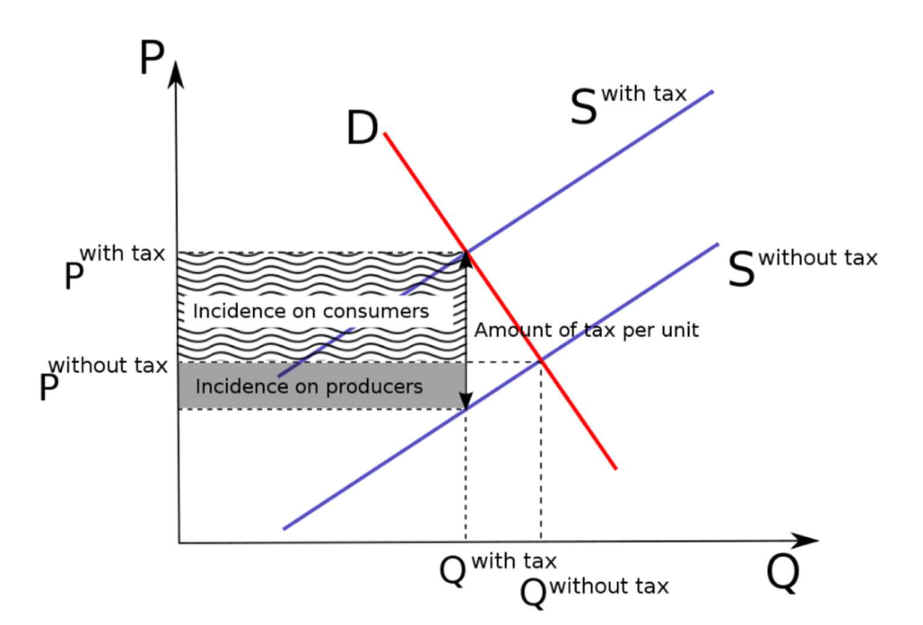
PEDs, in combination with price elasticity of supply (PES), can be used to assess where the incidence (or "burden") of a per-unit tax is falling or to predict where it will fall if the tax is imposed. For example, when demand is perfectly inelastic, by definition consumers have no alternative to purchasing the good or service if the price increases, so the quantity demanded would remain constant. Hence, suppliers can increase the price by the full amount of the tax, and the consumer would end up paying the entirety. In the opposite case, when demand is perfectly elastic, by definition consumers have an infinite ability to switch to alternatives if the price increases, so they would stop buying the good or service in question completely—quantity demanded would fall to zero. As a result, firms cannot pass on any part of the tax by raising prices, so they would be forced to pay all of it themselves.[38] More generally, then, the higher the elasticity of demand compared to PES, the heavier the burden on producers; conversely, the more inelastic the demand compared to PES, the heavier the burden on consumers. The general principle is that the party (i.e., consumers or producers) that has fewer opportunities to avoid the tax. In practice, demand is likely to be only relatively elastic or relatively inelastic, that is, somewhere between the extreme cases of perfect elasticity or inelasticity. ACDC Videos Tax Incidence Taxes on Producers Excise Tax Practice |
|
IX. Price elasticity of supply is the % change in quantity supplied divided by the %
change in price. |
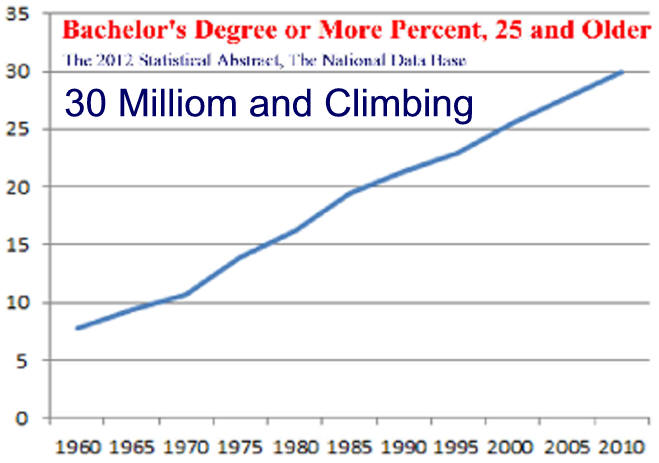
Elasticity of Demand for
College Graduates
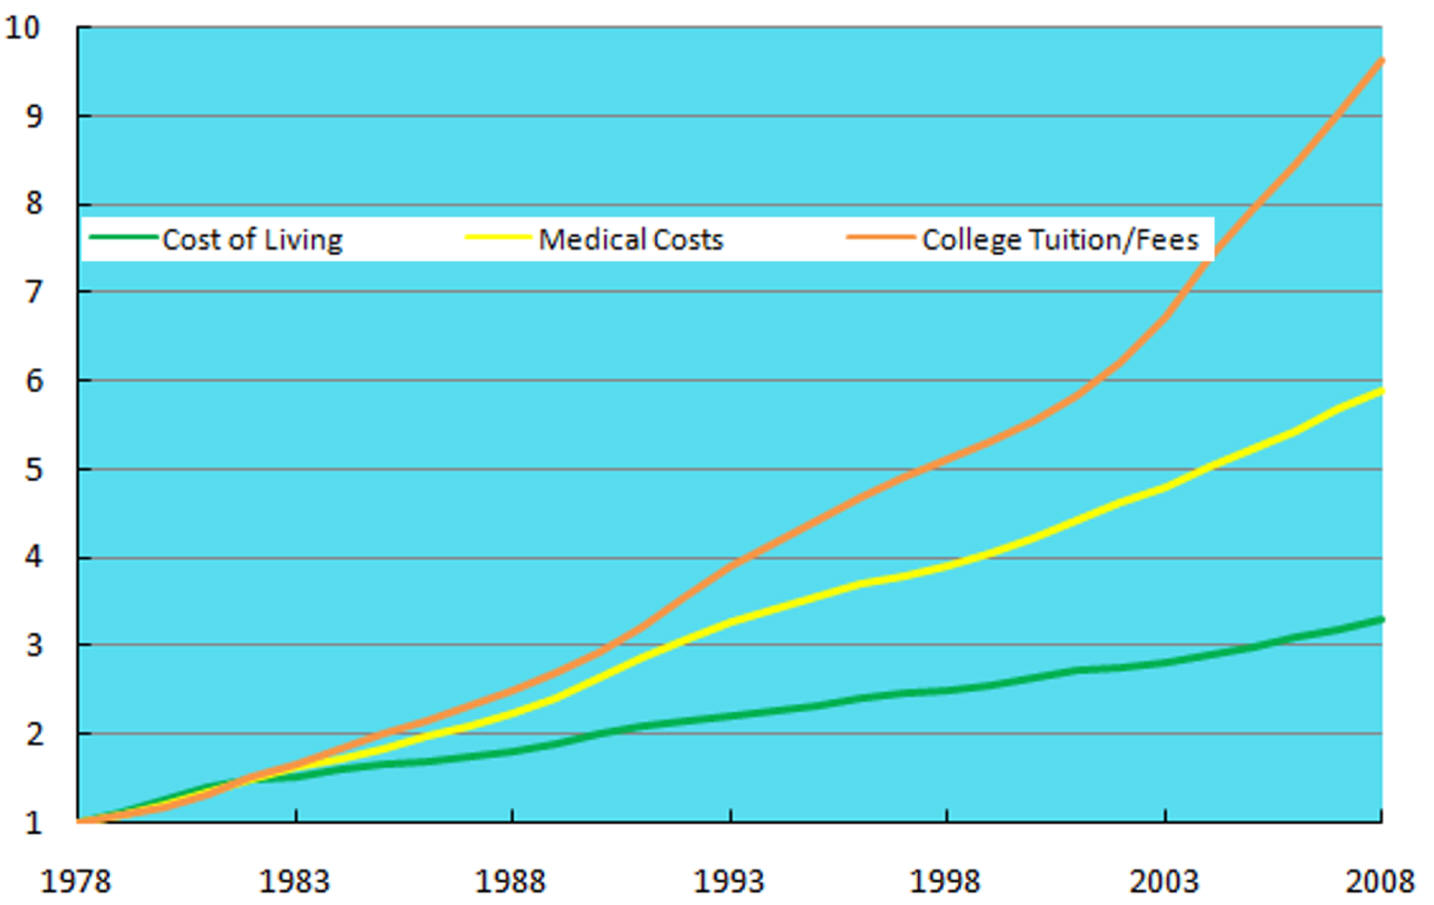
B. Price is up much more than even health care! 1. Cost of living tripled 2. Health care up six times 3. College tuition/fees almost ten times
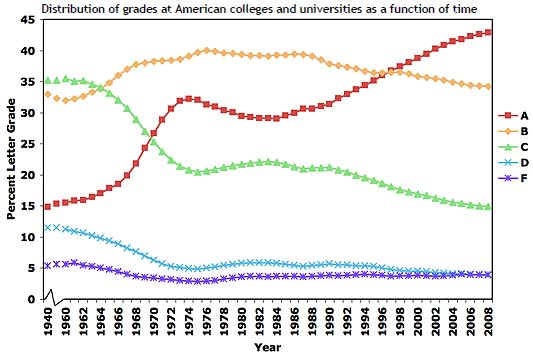
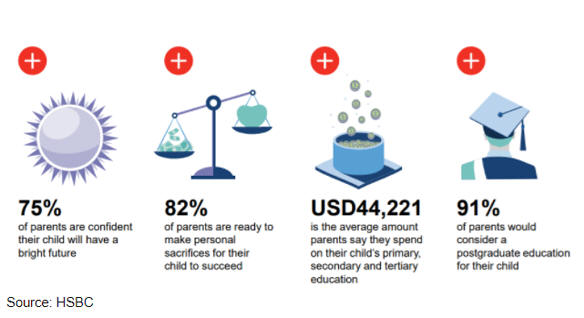
1. The include graduate degrees in with just a bachelors' degree when reporting income figure for bachelors'' all students with a knowing that people with just a bachelor's degree earn much less than those that also have advanced degrees. 2. In the bachelors degree only group those prejudice for college use average earnings rather than median earnings as averages are skewed higher by high by STEM majors. See Effect of Education on Income 3. Grade inflation is used to convince students and parents their money is being well spent! Colleges teachers are increasing their own economic well-being by using high grades to make demand inelastic. Were college catalogs changed to say average is B+ to A-? Grade Inflation as A's and B's Increased from 40% to about 85% Making Product Look Like a Better Investment.
4. To maximize revenue private
colleges
6. Demand id Inelastic
|
Advanced Degrees Graduates
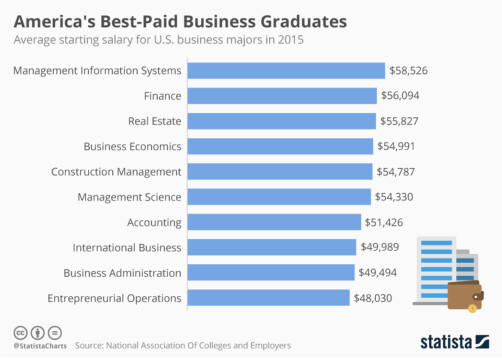
Stem Graduates Make Much More
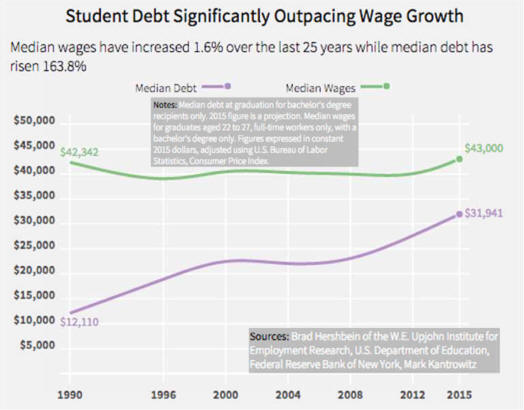
Bachelor's Only Earn Little Can't Pay for
Loans
7. Result US Students Pay Lots
|
v