|
Chapter 17 Budget Deficits III. Relative Size of Federal Debt IV. Should the Federal Debt Be Paid Misuse of Economic Data 10/2/24
|
 |
|
Chapter 17 Budget Deficits III. Relative Size of Federal Debt IV. Should the Federal Debt Be Paid Misuse of Economic Data 10/2/24
|
 |
|
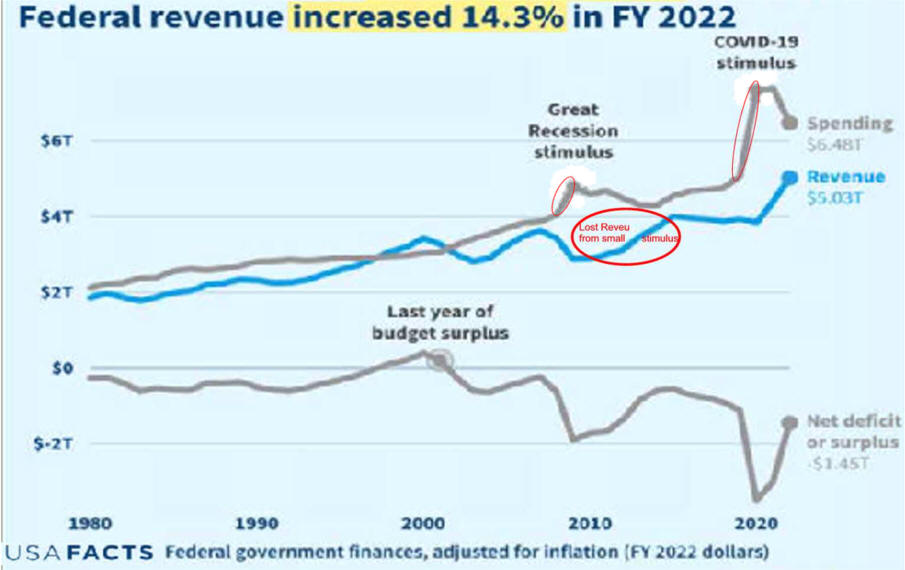
Prelude to Disaster? Less Taxes Collected During 21st Century
Deficits Been Going on for a While
|
|
I. Three Budget Philosophies
Editor's
Note: I'm sure one could find a conservative economic analysis
attributing
Applying Economic Statistics to the solution of
D.
The History Of The
American Economy, Debt, Inflation
video
E.
Experience of the 1990's |
Political Economy Stuff
The Good
Debt Softened the Great Recession.
Reasons Debt Continues
Who Got the Money
A Tax Cut When Unemployment is Low and Falling
|
|
F. Experience of the 2000's 1. Dot com bubble begins the decade. 2. 9/11 adds to insecurity 3. Fiscal Policy of tax cuts and reform plus cash payment keeps growth high, deficit reasonable. 4. Financial Instability cause by 1980's finally leads to Deep-Do-Do or D3 for mathematicians. 5. US Bailout Using Debt Works 6. Austerity Fails Europe 7. Financing The U.S. Response To COVID-19
G. Readings |
Trickle-Up Had Better Work!
|
|
II. Federal Tax Receipts are Complicated A. Tax expenditures the loss in tax revenue from items that lower taxable income have a substantial affect what is paid by tax entities. 1. Tax deductions and Tax Credits affect the bottom line the same as traditional expenditures. 2. They are designed to benefit select groups with political clout
3. Politicians have
made increased
tax expenditures dramatically since
1986 because
4.
Taxing
the Rich |
|
|
III. Relative Size of
Federal Debt
Federal Debt as % of
GDP |
 |
|
IV.
Should the
Federal Debt be Paid
D.
Modern Money & Public Purpose 1 hour
plus |
Who Has Paid For the Federal Debt?
What if the Federal Budget Was $100 Mark Blyth Videos Devastates Approach to Budget Liberal View of Balanced Budgets Interest Payment Management Approach Please link to and Share! 10/2/22 |
|||||||||||||||||||||||||||||||||||||||||||||
|
Editor's Note:
|
||||||||||||||||||||||||||||||||||||||||||||||
|
18 Financial Report of the U.S. GovernmentThis is who paid the $3.4 trillion in revenues:
We Got the $4.5 trillion in spending:
|
|
Editors Note: Revolutionary War debt had been piled up by both state and federal governments. Secretary of the Treasury Alexander Hamilton orchestrated the first federal tax on imports in 1789 to pay federal and state debt . This debt was our largest federal debt related to GDP until 1933 when the Great Depression crushed revenue collections which caused deep- do-do (d-cubed). Secretary of the Treasury Alexander Hamilton began the practice of increasing taxes to pay for war expenses. Printing money causing inflation usually helped. This practice continued for over 150 years. Then both Hover and Roosevelt borrowed not for war but to help people survive the Great Depression. Then Bush II reversed over 200 years of logic as he cut taxes during good times so as not to pay for wars in Afghanistan and Iraq plus he created entitlement Medicare Part D. Hamilton's paying state war debts began federal government practice. Today many states take the money and show their appreciation by telling the federal government to stay out of state and local business.
|
Individuals also follow the practice of
taking and saying stay out of my business. State and Local Governments can't print moneys so they can't have deficits. They use unfunded pension and health liabilities to cover future spending. Unfunded state and local employee and retiree benefits would head list of major contributors to state and local liabilities. I don't like the term entitlement programs when they are financed by individuals paying into a fund. This is especially true since there is not a contract so what the government gives it can take away so the word entitlements is a sham. Governments spend so much more than is taken in that balancing the budget is futile. Living at such a peaceful and prosperous time should allow cuts in the gravy train but Greed, Guns, God, and Government get in the way. Source |
|
V. Almost Everyone Gains From Federal Debt?
In the Good Old Days, FED's
Borrowed To Finance War
|
 |
|
Inflation To Date Has Paid Much of the Bill But some were hurt by government financing with debt and inflation.Revolutionary War veterans were paid in worthless currency which they sold at a large discount to wealth people who were then helped by Hamilton's decision to redeem at full value. This could happen again as debt is bought by the wealth on margin on borrowed money at low Federal Reserve sponsored interest rates. Some states had paid their revolutionary war debt and were not helped by Hamilton's decision to assume all war debts. Financial stress caused by financial excesses were substantial during the 19th century and early 20th century. Inflation during the 1970's hurt fixed income often retired older residents and fixed asset people. SS was not indexed to inflation until early 1980's. BUT, recent
financial crisis's have been moderated by government
|
|
|
In 1980, my friend Mr. Average lamented his Social Security
pension would be small. He wished the government would
take more out of his pay to increase his expected pension. This would be
difficult as Social Security was having financial problems soon to be solved by
a bipartisan commission chaired by a man named Greenspan. It recommended, Congress passed, and the President signed
a social security tax
increase, an increase in the wages subject to Social Security, and a
delay in the normal retirement age. My friends normal retirement age increased from 65 to
sixty-six. What have these
changes accomplished over the past 25 years.
|
Uncle Sam’s Unfunded Promises
October
8th, 2017 "Of course, Congress could always authorize the Treasury Department to authorize the Federal Reserve to monetize a certain amount of the Social Security and Medicare debt, which is essentially what Japan is doing (and seemingly getting away with it). I think we should all be grateful to the Japanese for being willing to undertake such a fascinating experiment in monetary and fiscal policy." |
|
Outlook for Short-Term SS Trust Fund Adequacy? |
|
|
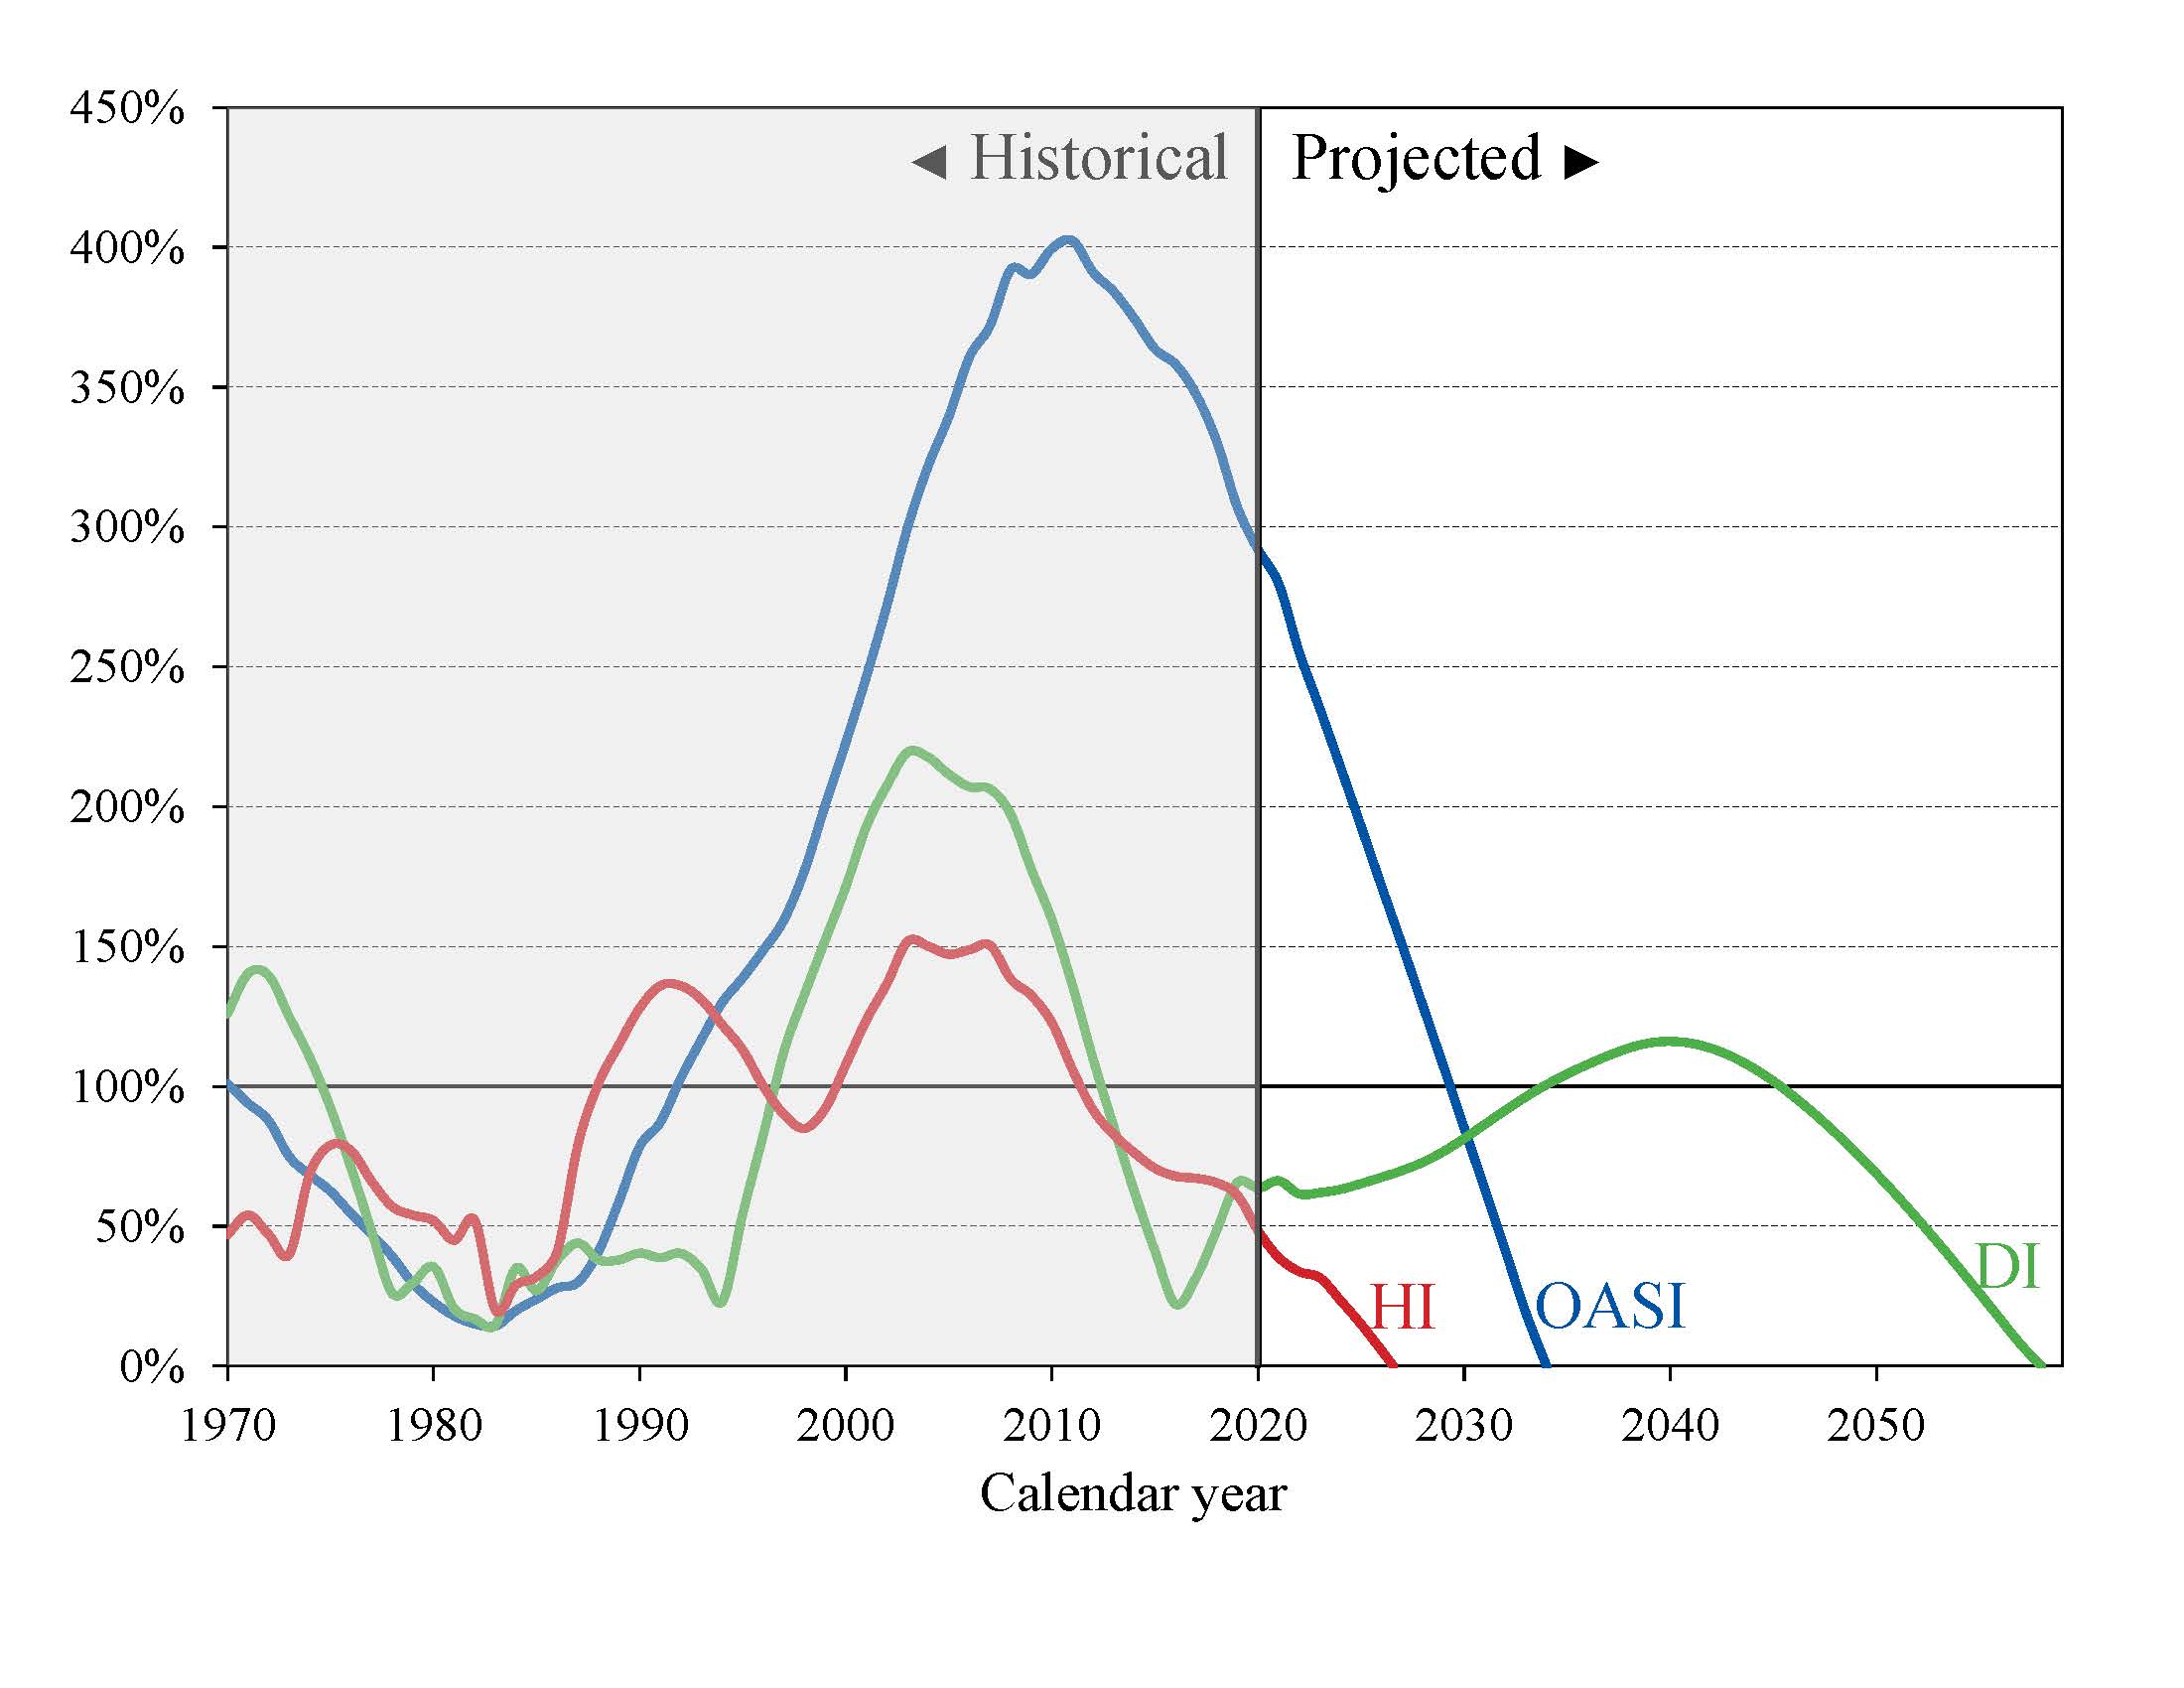
2013 Trustees Report measure short-range adequacy of OASI, DI, and HI Trust Funds by comparing fund asset reserves to projected costs for the ensuing year (the “trust fund ratio”). A trust fund ratio of 100 percent or more—that is, asset reserves at least equal to projected cost for the next year—is a good indicator of a fund’s short-range adequacy. That level of projected reserves for any year suggests that even if cost exceeds income, the trust fund reserves, combined with annual tax revenues, would be sufficient to pay full benefits for several years. By this measure, the OASI Trust Fund is
financially adequate throughout the 2013-22 period, but the
DI Trust Fund fails the short- range test because its trust
fund ratio was 85 percent at the beginning of 2013, with
projected depletion of all reserves in 2016. |
 |
|
White House delaying Social Security trustee report to factor in Health reform |
|
|
What to do! Options include
increasing the wage base being taxed, the tax rate, and delaying the maximum
benefit date. All were done in 1981. Ignoring the problem and borrowing the cash
will be difficult as borrowing much more than we already have will push interest rates higher on Treasuries and lower the value of the
dollar. So they will increase from $90,000 base soon because it is politically
easier although Republicans won't be happy. Then a bipartisan commission will be formed to increase rates,
wages
subject to Social Security taxes, and the normal retirement age. A commission shares the political burden. Indexing Social Security to wages has caused Social Security pensions to increase. Wages go up because of inflation and productivity. A plan indexing pensions to inflation lowers pensions and a Presidential/Congressional cash crisis is avoided for a while. The Center for Retirement Research at Boston College analyzed this change. My friend Mr. Average just retired at 65 and receives $14,689. Had we indexed to inflation in 1951, the average Social Security pension would be lowered by $2,131 to $12,558. To be candid, my friend Mr. Average needs this additional income. Let us move ahead to 2025. Under the current system, Mr. Average will receive $16,205 in 2005 dollars, a $1,516 increase. If indexing to inflation passes Congress and is approved by the President, Mr. Average will receive only $14,689 in 2005 dollars. No real increase because he would not share in productivity increases. His pension would be larger in 2025 because it was but he could only buy the same amount of goods and services as in 2005. |
 |
|
The Real Story The Center for Retirement at Boston College also reports the entire mess can be solved by increasing the normal retirement age from 67 to 70 over a period of years for people under 45 or people under 55 could receive a benefit cut of 20%. Becoming Oldest-Old: Evidence from Historical US Data from MIT shows we are living longer. Since Social Security was adopted in 1935, life expectancy for someone 65 has increase by almost 5 years to almost 17 years. Since these numbers are going up, my friend Mr. Average is making out very well. My normal retirement age is 66 years. Hopefully I will pay for one more year and collect for 4 more years. Not bad! Boston College has more on Social Security. Read
Historical Development of Social Security (In Adobe PDF format)
|
Not All Debt is Created Equal.
|
|
VI. Predicting Deficits
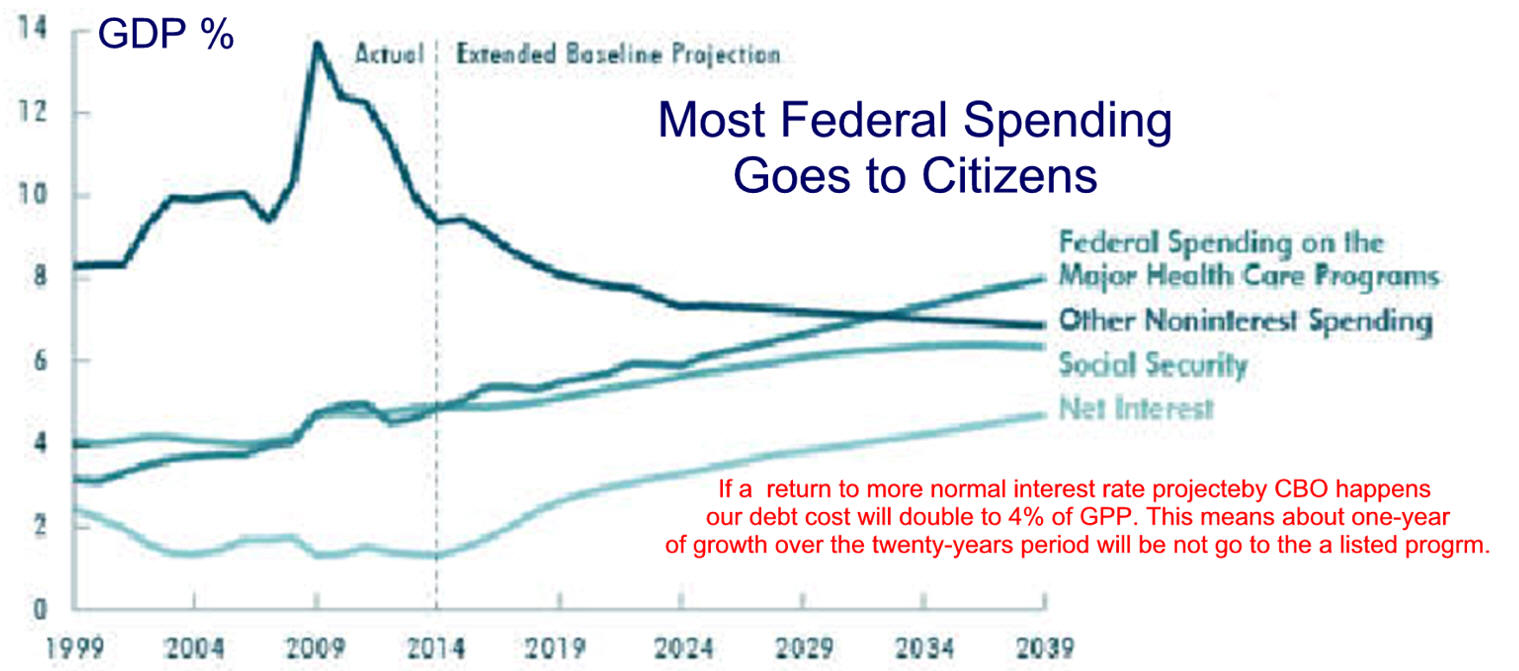
The most recent projections from the OMB indicate that, if current policies remain in place, the total unified surplus will reach $800 billion in fiscal year 2011, including an on-budget surplus of $500 billion. The CBO reportedly will be showing even larger surpluses. Moreover, the admittedly quite uncertain long-term budget exercises released by the CBO last October maintain an implicit on-budget surplus under baseline assumptions well past 2030 despite the budgetary pressures from the aging of the baby-boom generation, especially on the major health programs. The most recent projections, granted their tentativeness, nonetheless make clear that the highly desirable goal of paying off the federal debt is in reach before the end of the decade. This is in marked contrast to the perspective of a year ago when the elimination of the debt did not appear likely until the next decade. |
|
|
The Wild Card
|
|
VII. Solutions
Options For Reducqqing The U.S. Deficit
Use Alternative Inflation Measures
Bernie Sanders' 2016 Advisor On Trump/Debt/Modern Monetary Theory 3/4/19
| Next Chapter | |
| Chapter 15 Class Discussion Questions | Economics Interactive Course Notes |
| Chapter 15 Homework Questions | Economics Internet Library |

|
Many industrial countries have debt. |
||
| Country | 2003 Central Government Debt as a percent of GDP All are higher in 2015. |
|
| Japan | 155% and stagnate population makes problem more difficult to solve. | |
| Italy |
106% and
tendency toward socialism makes problem more difficult to solve. |
|
| Canada |
77% and tendency toward
socialism makes problem more difficult to solve. |
|
| Germany |
64% and tendency toward
socialism makes problem more difficult to solve though a major decrease in the social safety net should help |
|
| United States | 62% | |
| Great Britain | 51% | |
| Source: 2004 World Fact Book of CIA | ||
|
Editor's Note: you can get in Excel with FRED
plug-ins
at
|
US Debt Compares Favorably
|
|
|
|
|
|
COVID Adds Big Time to Debt
|
|
The largest single institution holding U.S. government-issued debt is Social Security's Old Age and Survivors Insurance Trust Fund, which is considered to be an "Intergovernmental" holder of the U.S. national debt, and which holds 13.9% of the nation's total public debt outstanding. The share of the national debt held by Social Security's main trust fund is expected to fall as that government agency cashes out its holdings to pay promised levels of Social Security benefits, where its account is expected to be fully depleted in just 17 years. Under current law, after Social Security's trust fund runs out of money in 2034, all Social Security benefits would be reduced by 23% according to the agency's projections. The largest "private" institution that has loaned money to the U.S. government is the U.S. Federal Reserve, which accounts for nearly one out of every eight dollars borrowed by the U.S. government. It lent nearly all of that total since 2008, mainly through the various quantitative easing programs it operated from 2009 through 2015 in its attempt to stimulate the U.S. economy enough to keep it from falling back into recession. In September 2017, the Fed announced that it would begin reducing its holdings of U.S. government-issued debt. |
Overall, 69% of the U.S. government's total public debt outstanding is held by
U.S. individuals and institutions, while 31% is held by foreign
entities.
China has resumed its position as the top foreign holder of U.S.
government-issued debt, with directly accounting for 6.9% between institutions
on the Chinese mainland and Hong Kong. politicalcalculations.blogspot.com
|
|
|
Who is On Tax Expenditure Assistance Social
insurance taxes -SS + Medicare = deep doo-doo
|
|
|
|
|
|
Few Pay More Income Taxes
|
|
|
Economy Is Soaring, And Now So Is The Deficit. That’s A Bad Combination.
|