Price
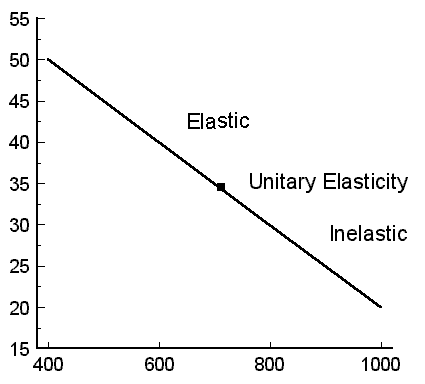
Ed = (Q2 -Q1) / [Q2 - Q1)/2] / (P2 - P1) / [(P2 - P1)/2]
20
1000
ED = (200/900) / (10/25) = .56


ED = (200/700) / (10/35) = 1.00


ED = (200/500) / (10/45) = 1.80
30
800
40
600
50
400
|
|
eBooks SearchInclude Read Aloud for titles that can be read aloud. |
Homework answers.
File 19 Questions for homework
1. Graph the following
demand schedule. Complete the chart by first inserting the formula
for the
coefficient of price elasticity of demand. Calculate elasticity of demand and
show the three levels of price elasticity of demand on a graph.
|
Price |
Quantity |
Ed = (Q2 -Q1) / [Q2 - Q1)/2] / (P2 - P1) / [(P2 - P1)/2] |
 |
|
20 |
1000 |
ED = (200/900) / (10/25) = .56 ED = (200/700) / (10/35) = 1.00 ED = (200/500) / (10/45) = 1.80
|
|
|
30 |
800 |
||
|
40 |
600 |
||
|
50 |
400 |
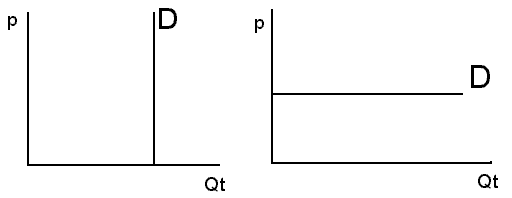
2. Draw both a perfectly
elastic and perfectly inelastic demand curve. Give an example of each
and state
the characteristics that determined their elasticity.
 |
Examples:
Agricultural: potatoes are close to perfectly elastic although both Maine
and Idaho would like to convince us differently. Purdue did convince many
his chickens are better.
Insulin is products is close to perfectly inelastic for diabetics. |
|
Characteristic
Elastic
Inelastic product type luxury necessity % of budget high low substitutes many none eregency little lots |
File 20 Questions for homework
1. Use the utility maximizing rule to determine how many of goods A, B,
and C to purchase with a $22 budget.
List the order in which the goods would be
purchased.
|
Good A costs $4.00 |
Good B costs $3.00 |
Good C costs $2.00 |
|
Qt. MU MU/$ Rank |
Qt. MU MU/$ Rank |
Qt. MU MU/$ Rank |
|
1 8 2.0 1st |
1 6 2.0 1st |
1 2.0 1.0 5th |
|
2 6 1.5 3rd |
2 5 1.67 2nd |
2 2.0 1.0 5th |
|
3 4 1.0 5th |
3 4 1.33 4th |
3 1.5 0 .75 |
|
4 2 0.5 |
4 3 1.0 5th |
4 1.5 0.75 |
| Three units of x, 2 units of y, and 2 units of z were purchased. | ||
2. Explain why most consumers receive a surplus when purchasing a product.
| Goods are purchased at an equilibrium price. Buyers would be willing to pay more than the equilibrium price for quantities below the equilibrium quantity. Paying the lower equilibrium price is thought of as a surplus. | 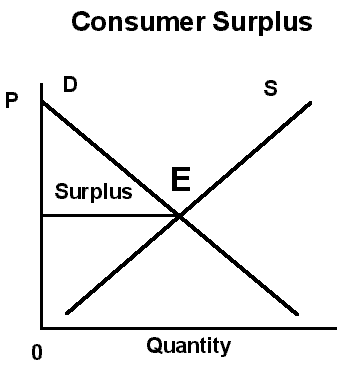 |
3. Graph the following data and calculate the MRSXY.
| Video Tapes Per Month |
A Night On The Town |
Marginal Rate of Substitution |
|
|
| 1 | 13 | |||
| 2 | 9 | 4 | ||
| 3 | 6 | 3 | ||
| 4 | 4 | 2 | ||
| 6 | 3 | .5 | ||
| 9 | 2 | .33 | ||
| 13 | 1 | .25 |
File 21 Questions for homework
1. Below each variable place its formula, finish the chart, and graph the results.
| Units Produced (1) |
Total
Fixed Costs (2) |
Total Variable
Costs (3) |
Total Costs |
Marginal Costs | Average Fixed
Costs |
Average
Variable Costs |
Average Total Costs |
| Insert Formula | |||||||
| 0 | 400 | 0 | 400 | Undefined | |||
| 1 | 400 | 200 | 600 | NA | 400 | 200 | 600 |
| 2 | 400 | 300 | 700 | 100 | 200 | 150 | 350 |
| 3 | 400 | 375 | 775 | 75 | 133 | 125 | 258 |
| 4 | 400 | 425 | 825 | 50 | 100 | 106 | 206 |
| 5 | 400 | 500 | 900 | 75 | 80 | 100 | 180 |
| 6 | 400 | 700 | 1,100 | 200 | 67 | 117 | 183 |
| 7 | 400 | 1,000 | 1,400 | 300 | 57 | 143 | 200 |
| Graphs are not depicted. There shape is similar to those depicted in file 21. | |||||||
2. List examples of the types of costs incurred by the Music Emporium.
| Fixed Costs | Variable Costs | Explicit Costs | Implicit Costs |
| rent | labor | all | Darin's time |
|
fixed assets |
utilities | accounting costs | Darin's capital |
| property taxes | advertising | ||
| merchandise |
File 22 does not have homework questions.
File 23 Questions for homework
1. Use two graphs to depict the supply and demand relationship between a purely
competitive industry and a firm within the
industry making a profit. Explain the likelihood of this situation continuing.
|
|
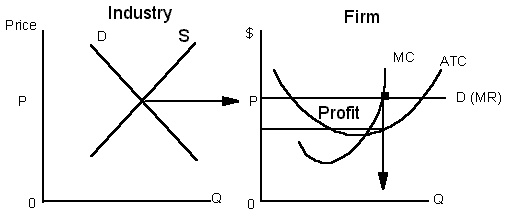 |
Entry into this market is easy and many seeing the profit
will enter the market.
Free international trade makes markets more competitive and lowers profit. |
|
| 2. Use graphs to depict a purely competitive adjustment. Explain why the adjustment takes place. | |
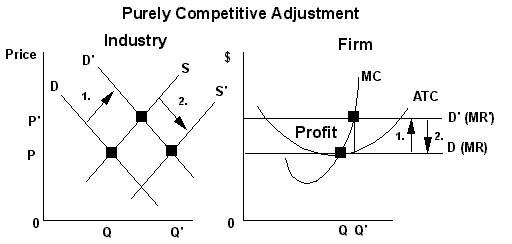
|
Suppose industry demand and supply yield an equilibrium price
P at which a firm's economic profit is zero. 1. Step 1 indicates an increase in demand to D' causing economic profit. 2. Market entry is relatively easy and this profit draws in new firms increasing supply to S'. Economic profit disappears. 3. This automatic purely competitive adjustment causes equilibrium long run economic profit for pure competition to be zero. To many, zero long run economic profit represents an ideal economic model as all the company earns is a normal return on investment. |
3. Give an economic analysis of pure competition.
A. Competition is
efficient.
1.
Price settles where long-run ATC is at its lowest point indicating goods are
produced efficiently.
2.
P = MR = MC indicating that resources are allocated efficiently as the
$'s spent by consumers (P) = the $'s received by producers (MR) = the
$ cost of producers (MC) and
economic profit is zero.
B. Shortcomings
1.
Spillover costs (pollution) and benefits (education) aren't properly measured
resulting in goods being
over and
under produced.
a. Government intervention was needed to lower automobile pollution.
b. Governments supports education with grants and inexpensive loan problems
to students and colleges.
2.
Monopoly power develops to negate Adam Smith's "invisible hand" of
competition which is required
to assure that the purely
competitive adjustment occurs.
3.
Eliminating economic profit makes it difficult for competitive firms to afford
expensive R & D and technology.
File 24 Questions for homework
1. Contrast a monopoly making a profit with one trying to minimize its loss. What circumstances could cause a monopoly not to make a profit?
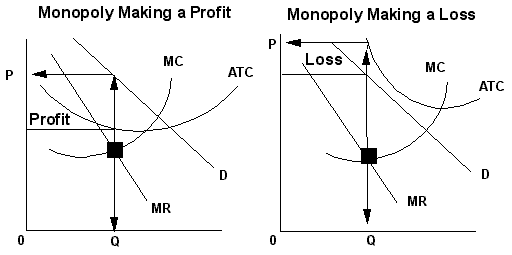 |
|
|
| A. ATC includes normal return on investment. B. MC cuts ATC at lowest point. C. Profit is maximized by producing a quantity and charging a price indicated by the intersection of MC and MR. D. The resulting profit is not a payment for enterprise, it is economic rent. E. High inelastic demand will result in a higher price, greater profit, and a more restricted (smaller) quantity. |
A. Rising costs and shrinking demand may result in
a monopoly not making a
profit. B. When this happens, demand (average revenue) is always below the ATC and a loss results. |
|
|
2.
State the traditional reasons why a monopoly is not as efficient as a purely competitive firm.
Monopolies increase profits by restricting output to increase price.
|
||
File 25 Questions for homework
1. Draw a graph depicting a monopolistically competitive firm operating at a profit. Other things being equal, what will happen to this profit? Why?
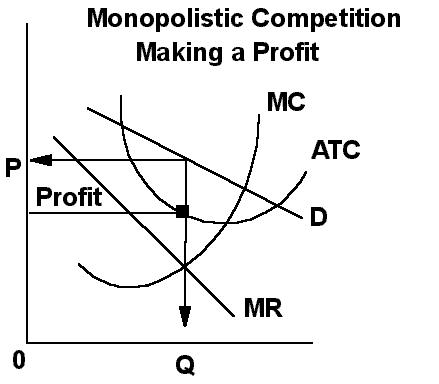
|
Some believe economic profit tends toward zero as the number of firms adjust to varying profit levels. |
2. Contrast the economic efficiency of a purely competitive firm with one operating in a monopolistically competitive market.
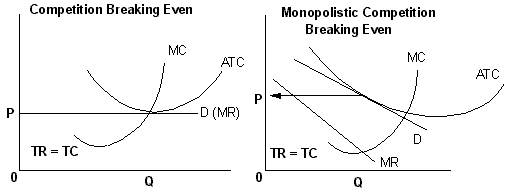 |
Because demand is not perfectly
elastic for monopolistic, it has a higher price and a lower quantity. |
File 26 Questions for homework
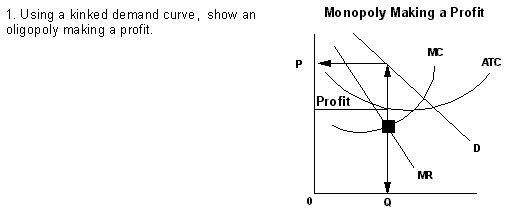 |
2. What changes in this situation would result in the firm breaking even or even
incurring a loss?
A. A decrease in demand or an increase in cost could eliminate profit.
B. A change in consumer attitudes increased demand for foreign cars during the 1980's.
C. OPEC price controls decreased supply and increased factor costs in the 1970's.
File 27 Questions for homework
1. Use the following data to calculate the optimum amount of resources to
employ Labor costs $12 and capital costs $18.
First calculate the proportion of resources to use and
then the absolute number to hire.
|
Quantity of Resources |
1 | 2 | 3 | 4 | 5 | 6 |
| Marginal
Revenue Product
Labor $12 Capital $18 |
||||||
| 42 | 36 | 30 | 24 | 19 | 12 | |
| 54 | 36 | 24 | 18 | 14 | 12 |
2. Use the substitution effect and output effect to explain how the personal
computer affected the supply and demand for office personnel.
The substitution effect results in fewer workers being hired as companies
purchase computers because of their high MRP per dollar.
This increase in output makes labor more productive increasing its MRP causing more labor to
be hired.
File 28 Questions for homework
1. Contrast a competitive market for labor with one that is monopsonistic.
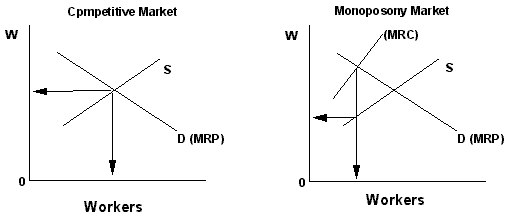 |
Monopsony pays a wage rate below MRC by paying the amount indicated by the individual supply curve.
|
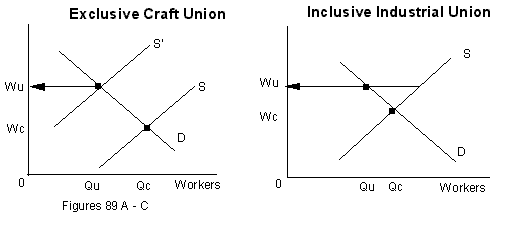
2. Depict and contrast how craft and industrial unions try to affect the wages received by their members.
 |
Our Tutors Available 24/7 |
|
| Tried to shift supply of workers to the left with licensing, apprenticeships, child labor laws, etc. to increase wages. | Try to control supply of workers and emphasized collective bargaining to increase wages. | |
3. Why might the monopolizing efforts of a monopsony and a union engaged in collective
bargaining result in a price and quantity similar to that of a competitive market?
 |
File 29 Questions for homework
1. Explain how the single-tax movement of the 19th century relates to the
idea of changing the current structure of
property taxes in America's cities.
Socialist philosophers questioned whether pure
economic rent should
be paid.
a.
Originally free, owners of land receive pure economic rent
which is a surplus.
b. Henry George wanted to tax rent away in 19th century
America.
1) Called the single-tax movement, he wanted to replace
all taxes with one tax on land.
2) Three problems exist with this philosophy.
a) Land is not free to current owners.
b) Capital improvements are necessary to make modern
land useful.
c) Modern rent does perform a rationing function
because
land is of such differing quality.
2. Name some industries that have recently
lost their economic rent. Was this rent deserved? Why did they lose the rent?
Who was hurt? Who was helped?
Automobiles, steel, and other Rust Belt oligopolies lost much of their
economic rent during the 1970's and 1980's.
The market felt it was deserved. The
primary causes were competition from overseas and an inability of company
managers to adapt to a changing environment. People hurt included owners,
managers, employees, suppliers, and
their communities. Both industries recovered but President Bush found it
necessary to increase tarrifs on imported
steel in 2002.Some feel antitrust activity against Microsoft is an attempt to
eliminate economic rent. In the short run,
consumers and those who invested in competing companies were the primary beneficiaries. In the long run, the theory
of creative destruction indicates a
more efficient system will result, and
all system participants will benefit.
File 30 Questions for homework
|
|
1. What did Ronald Coase demonstrate concerning government involvement with
the regulation of externalities?
Give an example of the application of his
theory.
Analysis by Ronald Coase revealed that government should not get involved
with disputes over externality costs
when property ownership is well-defined and
the number of people involved is small. He demonstrated that
individual
maximizing behavior would correct these problems. The government should only be
involved
when the
number of participants is so large as to make bargaining costs
prohibitive. For example, the government
should not get involved in a noise
pollution problem
near an amusement park but should get involved with
acid rain generated in
the
Midwest and falling into New England.
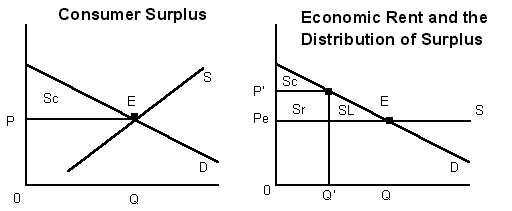
2. Depict how rent-seekers may obtain a surplus at the expense of the public good.
Question involves special interest groups such as PAC's, whose activities are self- serving and often at the expense of others.
3. Explain the market system solution to the problem of too much pollution.
Supply and demand are used to determine the price and quantity of some
tolerable level of pollution. Pollution is then considered a
factor of
production, and like any factor, it will be purchased based upon its marginal
revenue product.
File 31 Questions for homework
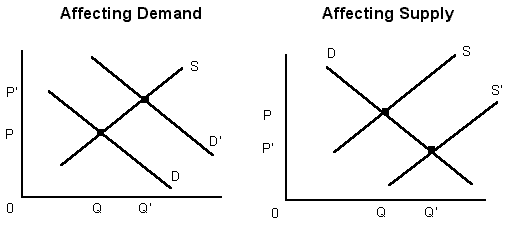
1. Explain how government subsidizes industry by regulating supply and demand.
|
|
|
A. Affecting demand 1. Tax credits, tax preferences, and loan programs for everything from agriculture to education increase taxpayers' demand by an amount related to the taxpayers' marginal tax rate. 2. Government also supports industries such as defense and agriculture with large purchases. |
B. Affecting Supply 1. Supporting industries such as agriculture and education with subsidies (loans, inexpensive insurance) increases supply, lowers price, and increases quantity sold.
2. Organizations such as the Export-Import Bank of the United States, |
2. What difficult market forces are encountered by the agriculture industry?
How do these forces affect supply, demand,
and the total revenue received by farmers? Explain how some of these forces were caused by government
actions; some
of which succeeded, some of which failed.
Farmers sell in an uncertain market
|
B. Supply and Demand for agricultural products is inelastic. |
C. Increased supply causes revenue to drop. |
|
|
|
1. Demand is very inelastic as people's physical needs are limited and
lowering price will not substantially increase quantity sold.
2. Demand increases slowly for most agricultural products as many are
inferior goods for which quantity demanded decreases
as income increases.
3. Supply is very inelastic in the short run as crops will only grow so fast
4. Supply is volatile because of the weather
5. Technology has caused supply to increase substantially
6. Annual supply fluctuations cause the prices farmers receive to fluctuate
considerably. Fluctuating prices mean fluctuating profits.
File 32 Questions for homework

2. Why and how was government regulation redirected during the 1980's?
A. In the 1980's, government regulation was redirecting away from maintaining
competition toward social regulation.
Government regulation of industry
changed direction because:
1. International competition requires companies work together in developing
high-cost technology and share in its high cost
2. Many feel government should foster cooperation among competitors with an
industrial policy while others feel the market
system should be left to
determine factor allocations
B. Regulations protecting individuals have become more prominent.
a.
Environmental Protection Agency (EPA)
protects individuals from pollution (air, water, noise).
b.
Consumer Protection and Safety Commission (CPSC)
protects consumers from unsafe products.
c.
Food and Drug Administration (FDA) protects
consumers from dangerous food, drugs, cosmetics, etc.
d.
Federal Trade Commission (FTC) protects the
consumer from unfair trade practices such as deceptive
advertising.
e.
Occupational Safety and Health Administration (OSHA)
protects people while at work.
f.
Equal Employment Opportunity Commission (EEOC)
attempts to eliminate workplace prejudice.
g.
National Labor Relations Board (NLRB) regulates activities between
business and unions.
3. Explain the concept of prosecuting conduct and not bigness
Rule
of reason
expressed the concept prosecuting conduct and not
bigness.
1.
Applied by the Supreme Court in a 1911 antitrust case against Standard
Oil of New Jersey and the American
Tobacco Company
2. Court stated that
behavior must be unreasonable in a competitive sense and anti-competitive
effects must be
demonstrated.
3. Both companies were
found guilty.
4. Compare horizontal and vertical mergers.
A. Horizontal integration results from a merger of competing companies. US
Steel
was formed by the merger
of competing steel companies.
B. Vertical integration involves companies that have supply dealings.
Standard Oil combined refineries and oil
transportation systems.
File 33 Questions for homework

2. Using the data from file 23, calculate the percentage increase in
poverty-level income for
a family of four and the percentage increase in median
family income received by couples with
the wife not working. Comment on the
results.
| Family of
Four Poverty Income |
% Increase | Median Family Income, Couples (wife not in paid labor force) | ||
| 1959 | $2,973 | |||
| 1970 | $3,968 | 23 | $9,304 | |
| 1980 | $8,414 | 112 | $18,972 | 104 |
| 1990 | $13,359 | 59 | $30,265 | 59 |
Appendix A Questions for homework
1. Complete this chart and related questions.
|
Hours to Produce |
Hours |
Maximum Computers |
Maximum TV's |
||
| Computers | TV's | ||||
| U.S. | 4 | 3 | 1,200 | 300 | 400 |
| JAPAN | 3 | 2 | 600 | 200 | 300 |
A. Which country has an absolute advantage in TV's? U.S.
in computers? Japan
B. Draw a linear production possibility frontier for each country putting TV's on the x-axis.
C. Calculate the opportunity costs for each product and each country.
United States: Computers = 400/300 = 1.33 TV's = 300/400 = .75
Japan: Computers = 300/200 = 1.5 TV"s = 200/300 = .67
D. Which country has a comparative advantage in which products? Why?
The United States has a lower opportunity cost in computer and therefore has a comparative advantage in making computers.
Japan has a lower opportunity cost in TV's and therefore has a comparative advantage in making TV's.
E. Which country should specialize in which product? Why?
The United States should specialize in computers and Japan should specialize
in TV's.
Total production of both products will increase and this increase can be
distributed through trade.
Appendix III Bibliography
1. The Age of Diminishing Expectation, Paul Krugman, The MIT Press, 1990.
2. America in the Global 90's, Austin H. Kiplinger and Knight A. Kiplinger, Kiplinger Books, 1989.
3. Apocalypse on Wall Street, David McClain, Dow-Jones Irwin, 1988.
4. The Bankruptcy of America, Stephen Wilson, Rindge Mills Press, 1992.
5. Business Almanac, Louis Rukeyser, Editor-In-Chief, Simon and Schuster, 1988.
6. Day of Reckoning, Benjamin M. Friedman, Random House, 1988.
7. Dollars and Dreams, Frank Levy, W.W. Norton and Company, 1988.
8. The Economic Future of American Families, Frank Levy and Richard C. Michel, The Urban Institute Press, 1991.
9. The End of the American Century, Steven Schlossstein, Congdon and Wood Inc., 1989.
10. The First Universal Nation, Ben J. Wattenberg, The Free Press, 1991.
11. Free to Choose, Milton and Rose Friedman, Harcourt Brace Jovanovich, 1979.
12. Generations, William Strauss and Neil Howe, William Morrow and Company, 1991.
13. The Great Crash of 1929, John Kenneth Gailbraith, Houghton Mifflin, 1988.
14. The Great Depression of 1990, Ravi Batra, Simon and Schuster, 1985.
15. Interest Rates, The Markets, and the New Financial World, Henry Kaufman, Times Books, 1986.
16. Head To Head, Lester Thurow, William Morrow and Company, 1992.
17. Made in America, The MIT Commission on Industrial Productivity,
The MIT Press, 1989.
18. The New Realities, Peter F. Drucker, Harper & Row, 1989.
19. The Next Economy, Paul Hawken, Ballantine Books, 1983.
20. The Overworked American, Juliet B. Schor, Basic Books, 1991.
21. The Politics of Rich and Poor, Kevin Phillips, Random House, 1990.
22. The Rise and Fall of the Great Powers, Paul Kennedy, Vintage Books, 1987.
23. The Roaring 80's, Adam Smith, Summit Books, 1987.
Appendix IV The Author's Favorite Questions
The following questions relate to the concept of creative
destruction (p.5):Creative destruction
of 20th century economist Joseph Schumpeterwas an important addition to the idea of capitalism.
1. Change involves the creation of improved economic structures
and the destruction of inefficient economic structures.
2. Capitalism allows this destruction to take place.
p.6-1.
How is the concept of creative destruction currently affecting theUnited States economy?
p.6-2.
Explain how the concept of creative destruction has affected European politics in the recent past and how it may affect European politics in the near future.p.23-1.
What structural changes (changes in the variables affecting economicactivity) are occurring as the 20th century comes to an end?
p.23-2. How do the structural changes discussed in Question #1 compare with
those of earlier periods?
p.48-1.
Have Americans lost their willingness to take economic risks?p.48-2.
How will demographic factors affect economic activity over the next decade or two?p.52-1.
How much should the citizens of the United States invest for thefuture? How should this investment be allocated between public and private investments? Who should make these investment decisions?
p.92-2.
Bob Gates, founder, developer, and primary owner of Microsoft Corporation, is said to be worth about 7 billion dollars. Discuss in "positive economic terms" (see page 1) this accumulation of wealth (see Question #3).
p.92-3. Discuss Question #2 in normative economic terms.
p.115-4.
Has the federal government helped those hurt in the past by the creative destruction caused by economic change such as the currentincrease in international competition? Should more be done to help those now being adversely affected by this international competition?
Questions that relate to college students' expected earnings:
p.10-2.
How would you expect government involvement in the market for college graduates to affect their market price? Has this happened?p.78-3.
What is your college community doing and what could they do to enhanceproduct diversification?
p.84-2.
Use the concepts explained in this chapter to analyze what college students can do to increase the amount they will earn upon graduation.p.110-2.
Why do you feel the Lorenz Curve for college graduates hasbeen depicting an increase in income inequality?
Interesting tax question
:p.14-2.
Is the benefit received by citizens from government economic activity linear in relation to income? That is, does a person earning $100,000 annually receive approximately twice the benefit received by someone earning $50,000?If not, what does a graph of the relationship look like?
INDEX
Absolute advantage 113
Accounting profit 11, 63
Aggregate demand (AD)
25, 26, 28, 31-32, 37, 39, 41, 42, 45, 51
Aggregate supply (AS) 26, 28, 45
Aid to Families with Dependent
Children (AFDC) 108
American Federation of Labor (AFL) 87
Antitrust laws 12, 103, 104
Automatic stabilizers 39
Average product of labor 63
Average Propensity to Consume (APC) 31
Average Propensity to Save (APS) 31
Average tax rate 16
Baby boomers 48, 52
Baighe book 36
Balance of payments 39
Banks 35, 36
Barter 7
Budget Accord of 1990 47
Budget deficit 49
Budget lines 60
Budget philosophies:
Annually balanced 49
Cyclically balanced 49
Functional finance 49
Business cycle 21, 39
Business population 15
Capital gains taxes 39
Capitalism 5, 11, 12
Celler-Kefauver Antimerger Act of 1950 103
Ceteris Paribus 1
Circular Flow of Money 5
Classical:
Equilibrium 28
Range 26
Clayton Act of 1914 103
Closed shop 86
Coase Theorem 95
Collusive pricing 79
Commodity money 35
Communism 6
Comparative advantage 113
Competition 12, 73
Competitive:
Market System 5
Model 85
Supply 73
Complements 7, 83
Concentration ratios 103
Conglomerates 103
Congress of Industrial
Organizations (CIO) 87
Consumer credit controls 42
Consumer Price Index (CPI) 20, 22, 50
Consumer Protection and Safety
Commission (CPSC) 104
Consumer surplus 59
Consumption 19, 25, 31, 39
Corporate income taxes 16
Corporate raiders 103
Corporation 15, 16
Cost-of-living increases 22
Cost-push inflation 22
Costs:
Explicit 63, 90
Fixed 63
Implicit 63, 90
Long run 69
Marginal 63, 64
Variable 63, 68
Creative Destruction 5, 113
Demand 7, 9, 67, 81
Demand-pull inflation 22
Demand schedule 7, 55
Demand theory 59
Democratic socialism 6
Determinants of growth 51
Diminishing marginal rate of substitution 60
Diminishing return 63
Discount rate 42
Disposable income 19, 31, 60
Durable goods 21
Economic growth 51
Economic models 1
Economic policy 1
Economic Recovery Tax Act of 1981 47
Economic:
Profit 11, 63, 90
Rent 89
Theory 1
Economics:
Classical 27, 37, 49
Descriptive 1
Normative 1
Planned 6
Positive 1
Economies of scale 69
Elasticity 55, 56, 57, 67, 83
Employment Act of 1946 39
Environmental Protection Agency (EPA) 104
Equal Employment Opportunity
Commission (EEOC) 104
Equation of exchange 37
Equilibrium price 8
Equitable distribution of income 12
Excise taxes 16, 47
Exports 19, 25, 31, 49, 99, 113
Externalities 12, 95
Factor Allocations 81, 82
Factor markets 72
Factors of production 2
Family income 15
Featherbedding 86
Federal Aviation Administration (FAA) 104
Federal budget 17
Federal Communications
Commission (FCC) 104
Federal debt 49, 50
Federal funds rate 42
Federal Reserve System 35, 36, 41, 47, 90
Federal Trade Commission Act of 1914 103
Fiat 35
FICA 17
Fiscal policy 21, 39, 40
Food and Drug Administration (FDA) 104
Food stamps 108
Friedman, Milton 37
Full employment 22, 27, 28
General Theory of Employment,
Interest and Money 27
George, Henry 89
Goods:
Inferior 7, 57
Superior 7, 57
Government spending 25, 31, 39
Government subsidies 99, 100
Great Depression 27
Green movement 52
Gross Domestic Product (GDP)
19-21, 26, 32, 41, 49, 50
Gross National Product (GNP) 19, 49-51
Humphrey-Hawkins Act of 1978 39
Imports 25
Income effect 7
Indifference:
Curves 60
Map 60
Industrial Revolution 83
Inelastic demand 55, 56
Inflation 22, 41, 45-47
Inflationary gap 32, 39
Inflationary psychology 46
Innovation cycle 21
Interest rate 25, 90
Intermediate range 26
International trade 113, 114
Interstate Commerce Commission (ICC) 104
Inventory recession 21
Investment 25, 31
Investment tax credit 39
Invisible hand 11
Jawboning 42
Junk Bonds 103
Keynes, John Maynard 27, 32, 37
Keynesian:
Economics 27, 31, 37, 39, 45, 47-49
Equilibrium 28
Range 26
Kinked demand curve 79
Labor 83
Laffer, Arthur 47
Laffer Curve 47
Laissez-faire capitalism 5, 27
Law of:
Demand 7, 59
Diminishing Marginal Utility 59
Increasing Costs 3
Supply 8
Leading indicator 22
Leakage 27, 35
Leverage buyouts 103
Liquidity Preference:
Precautionary 27
Speculative 27
Transactionary 27
Logrolling 96
Lorenz Curve 107
Macroeconomics 1
Macro equilibrium 25, 27
Mandatory breakdown 17
Marginal:
Physical Product (MPP) 81
Product of Labor 63
Propensity to Consume (MPC) 31, 33
Propensity to Save 31
Rate 16
Rate of Substitution 60
Requirements 42
Resource Cost (MRC) 85
Revenue (MR) 67
Revenue Product (MRP) 81, 89
Utility 59, 60
Market failures 12
Marketplace 7
Market systems 11, 15
Marx, Carl 6
Maximizing profit 68
Medicaid 108
Medicare 108
Mergers:
Horizontal 103
Vertical 103
Microeconomics 1, 54
Middle-class tax entitlements 12
Minimum wage 87
Misery Index 46
Mixed Economies 6
Monetarists 37
Monetary multiplier 36
Monetary policy 21, 41, 42
Money 20, 35-37, 41
Monopoly 72, 75-77, 81, 85-87, 103
Monopsony 85-87
Moral suasion 42
Multiplier 32
National income 19
National Labor Relations Board 86, 104
Neo Keynesian Economics 28
Net National Product 19
Noncyclical Fluctuations 21
Long-Term Secular Trends 21
Seasonal 21
Normal profit 11
Occupational Safety and Health
Administration (EEOC) 104
Okun's Law 22
Old Age, Survivors, Disability Health
Insurance 108
Oligopoly 72, 79, 80
Oligopsony 86
OPEC 46, 79
Open market operations 42
Open shop 86
Opportunity costs 2, 3, 63, 113
Parity pricing 100
Partnership 15, 16
Payroll taxes 16
Personal income 19
Personal income tax 16, 39
Phillips, A. W. 45
Phillips Curve 45
Planned economy 6
Political:
Action Committees (PACs) 96
Business cycle 40
Events 21
Poverty 108, 109
President's Council of Economic
Advisors 39
Price:
Ceilings 9
Elasticity 55, 57
Floors 9
Index 20
Levels 25, 28
Supports 100
Price-Wage Flexibility 27
Prime rate 42
Producer Price Index (PPI) 20
Product markets 54, 72
Production Possibility Curve 2
Profit 11, 67
Protectionism 114
Public sector activity 95
Rational expectations 37
Reaganomics 47, 48
Real balance effect 25
Receipts 16
Recessionary gap 32
Rent-seekers 96
Required rate of return 90
Reserve ratio 42
Resource demand 81-83
Robinson-Patnum Act of 1936 103
Rolling recession 21
Salaries:
Nominal 20
Real 20
Savings 19, 31
Say's Law 27
Schumpeter, Joseph 5
Sherman Antitrust Act of 1890 103
Shifting tax incidence 17
Smith, Adam 5, 27
Socialism 6
Social security 16, 17, 108
Sole proprietorship 15, 16
Spill-overs 12
Stagflation 45-47
Standard industrial classification 103
Static equilibrium 26
Static model 2
Substitutes 7, 83
Substitution effect 7
Supply 8, 9
Supply schedule 8
Supply-side economics 45-48
Taft-Hartley Act of 1947 86
Tax incidence 17
Taxation philosophies 17
Tax rates:
Progressive 16, 17
Proportional 17
Regressive 17
Tax Reform Act of 1986 47
Terms of trade 114
Token money 35
Total economic activity 19
Total Product of Labor 63
Total revenue 55-57
Trade deficit 48
Traditional economy 6
Transfer payments 12
Trusts 103
U.S. banking system 35
Underground economy 19
Unemployment: 21, 45, 46
Compensation 108
Cyclical 21
Frictional 21
Structural 21
Union model 85, 86
Union shop 86
User taxes 17
Utility maximizing rule 59
Velocity of money 37, 42
Wage determination 85
Wagner Act of 1935 86
Wealth of Nations 5, 27
Wheeler-Lea Act of 1938 103