|
Child and Youth
Well-Being Is Up Why do our successful efforts
to support
children 2) Child Health Insurance Works 3) Education Better But Press Misleads 5) Other Successes and A Failures See Economic Future Of Our Children
Updated 2/28/23 Please link to and
Share! |
|
|||||||||||||||||||||||||||||||||||||||||||||||||||||||||||||||||||||||||||||||||||||||||||||||||||||||||||||||||||||||||||||||||||||||||||||||||||||||||||||||||||||||||||||||||||||||


|
|
CHIP
enrolled 8,129,425 2/14 |
99.8% Missing Children Return |
|
|
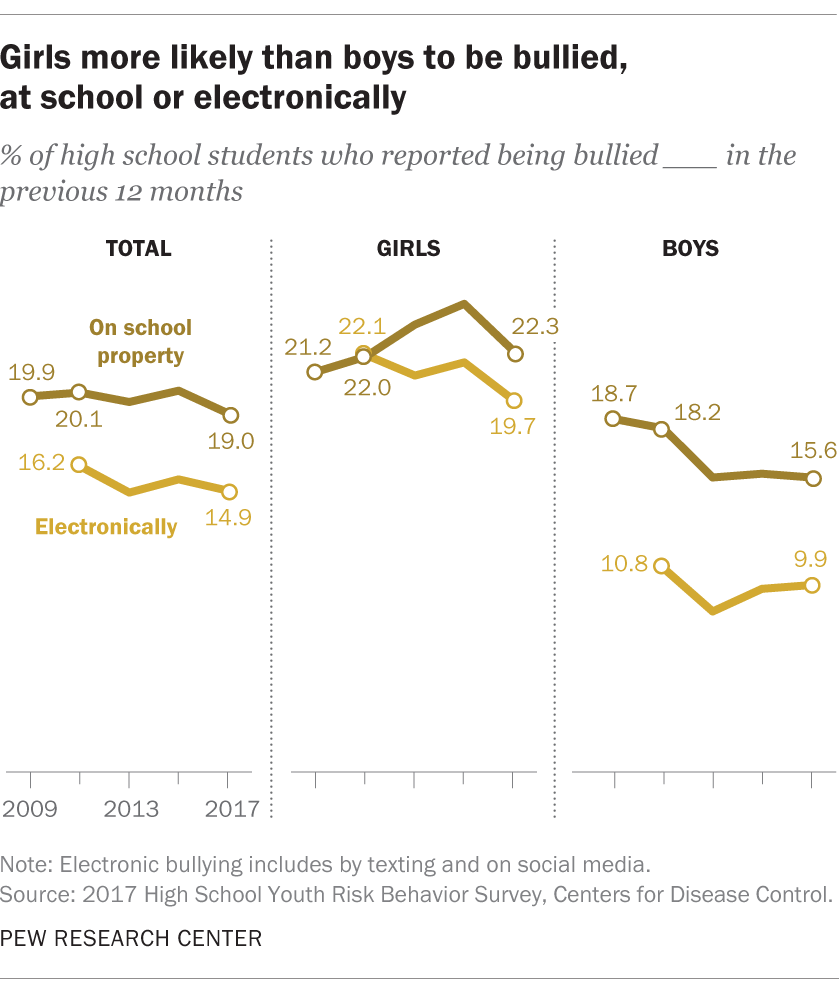
An Old Problem
Childtrends.org/indicators/bullying/ has more data.
|
|
|
|
 |
 |
|
|
|
|
|
BUT
|
|
|


|
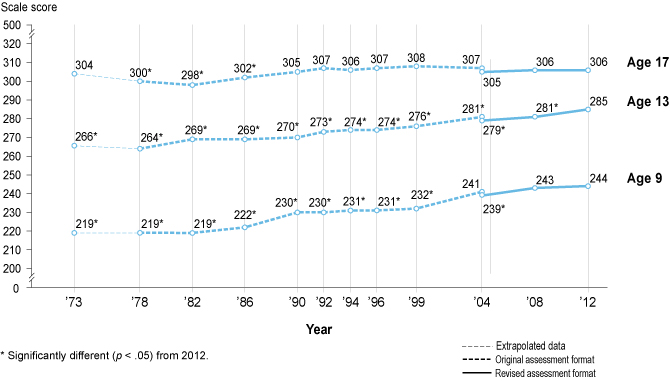
3) Education Better But Press Misleads
|
|
|||||||||||||||||||||||||||||||||||||||||||||||||||||||||||||||||||||||||||||||||||||||||||||||||||||||||||||||||||||||||||||||||||||||||||||||||||||||||||||||||||||||||||||||||||||||
|
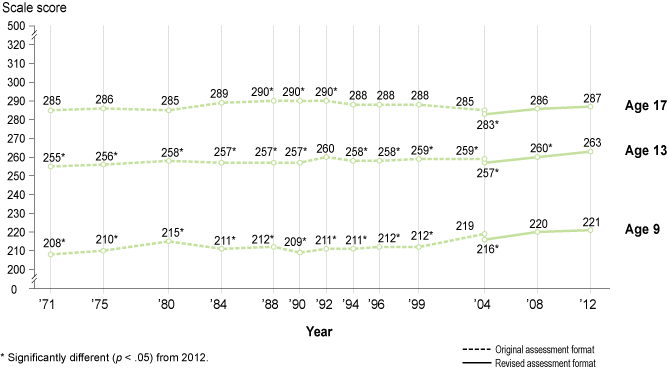
Trend in NAEP reading average scores for 9-, 13-, and 17-year-old students
|
Trend in NAEP mathematics average scores for 9-, 13-, and 17-year-old students
|
|||||||||||||||||||||||||||||||||||||||||||||||||||||||||||||||||||||||||||||||||||||||||||||||||||||||||||||||||||||||||||||||||||||||||||||||||||||||||||||||||||||||||||||||||||||||
|
|
|||||||||||||||||||||||||||||||||||||||||||||||||||||||||||||||||||||||||||||||||||||||||||||||||||||||||||||||||||||||||||||||||||||||||||||||||||||||||||||||||||||||||||||||||||||||
|
|
Why Don't Graduates Work?
|
|||||||||||||||||||||||||||||||||||||||||||||||||||||||||||||||||||||||||||||||||||||||||||||||||||||||||||||||||||||||||||||||||||||||||||||||||||||||||||||||||||||||||||||||||||||||


|
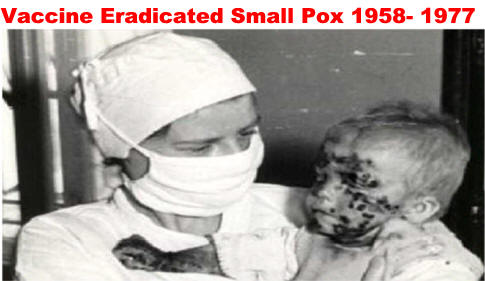
3Health
Problems Solved 1902 Scarlet Fever deaths peaked at close to 5,000 and then slowly dropped thanks to penicillin. 1905 Last Yellow Fever epidemic killed 20 in US as misquote control eliminated cause. 1936 vaccine ended disease. 1916 Measles 12,000 mostly children died. Vaccine finally eliminated most cases by early 1980's. 1918 Spanish Flu 500,000 died in US. This could have been the cause of the post WW 1 recession. 1921 Diphtheria 206,000 cases, 15,520 deaths, mostly children died. 1943 Penicillin 1,000,000 lives be saved during the 20th century. 1953 Polio 57,628 cases with 21,000 paralyzed Vaccine followed and Polio is now about gone. 1957-58 Asian Flu 70,000 died in US. 1968-69 Hong Kong Flu 34,000 died in US. 1973 US ends Conscription 1985-95+ AIDS killed ten to twenty thousand per year in 1970's. Annual deaths peaked at 41,699 in mid 1990's and then they quickly dropped due to super drug development and availability. Total US deaths were 658,507. 2011 TB From a 50% kill rate in 1900 cases dropped from 86,304 in 1959 the first year of data availability to 10,528 in 2011. 529 died in 2009.
By the 1960's Measles, Mumps, Rubella and a 1995 Chicken Pox vaccines made childhood safer and more enjoyable
|
|

